


 Brand Tools · Templates
Presentation Templates
Branded PowerPoint decks and infographics you can browse, preview, and download. Drop them into your own presentation or the Pyramid master template.
Master Template
The foundational Pyramid deck — cover, agenda, section dividers, content layouts, and a closing slide. Build your presentation here first, then layer in an infographic pack below for richer visuals.
Open the master templateAdd an infographic pack
Each pack is a PowerPoint file of ready-made visuals — drop a slide into your deck and edit the labels. Click any card to preview every slide, then download it. Not sure where to start? Search below, pick a category, or just scroll through them all.
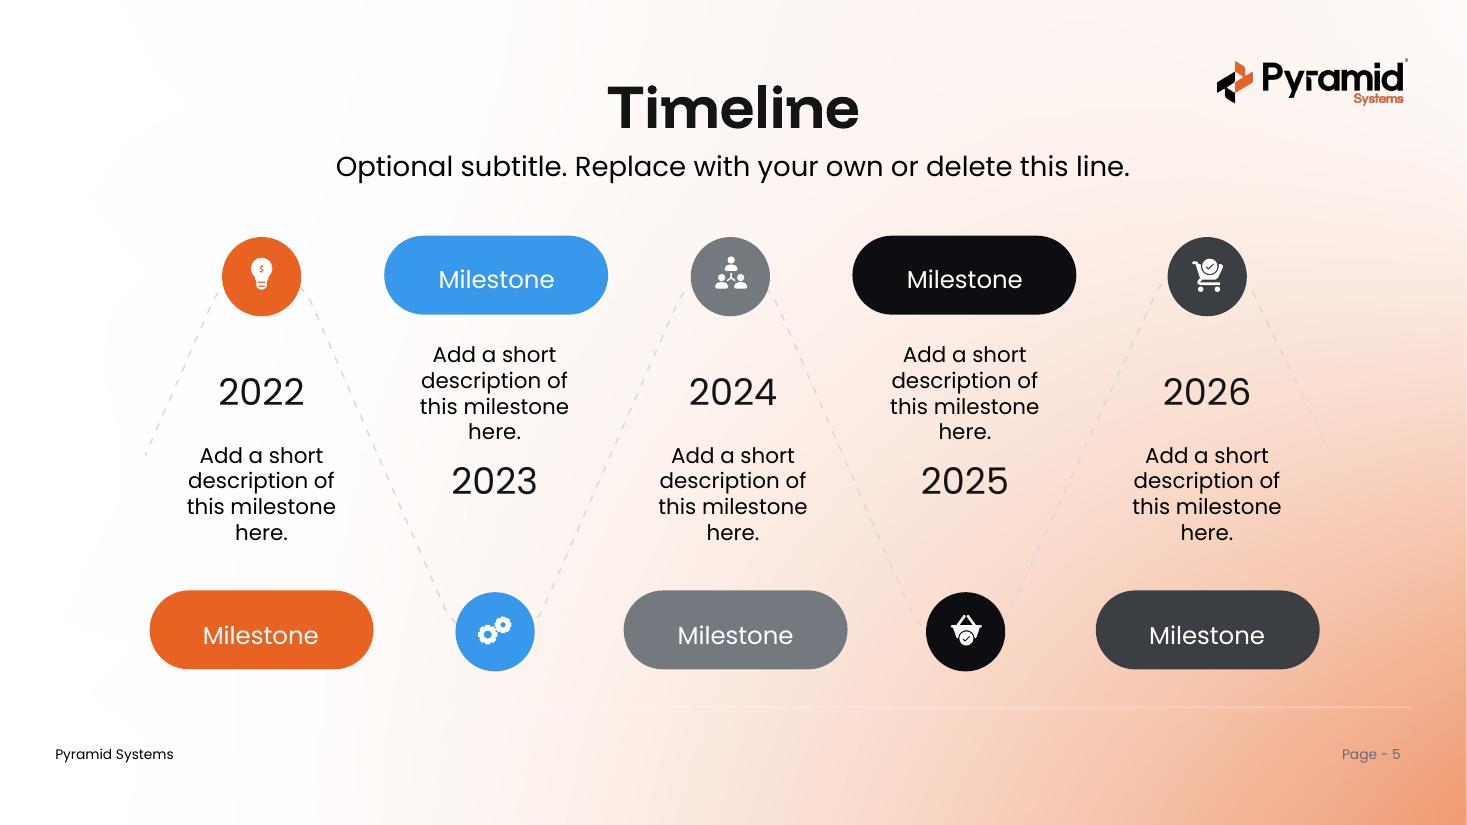
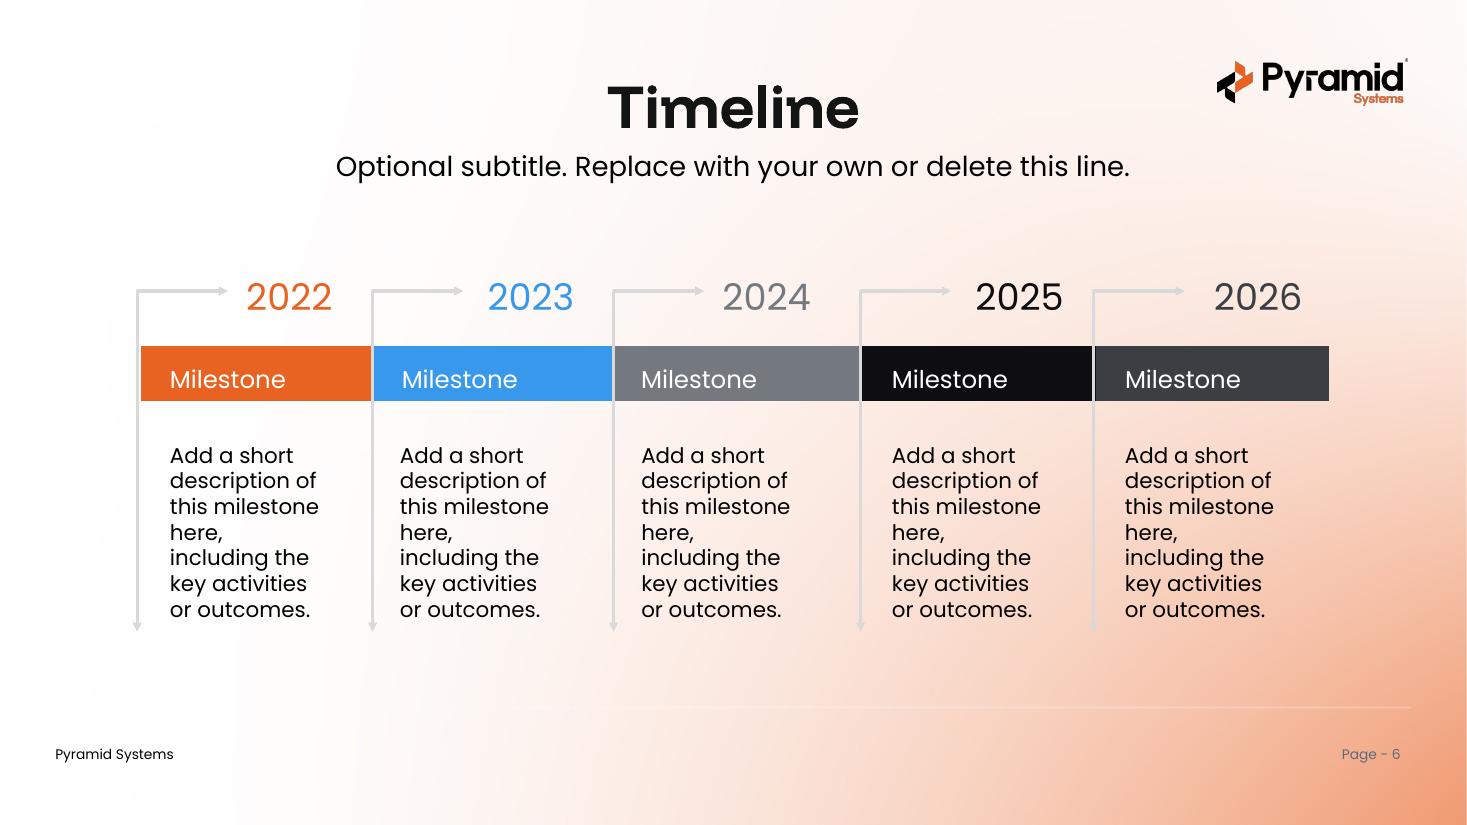
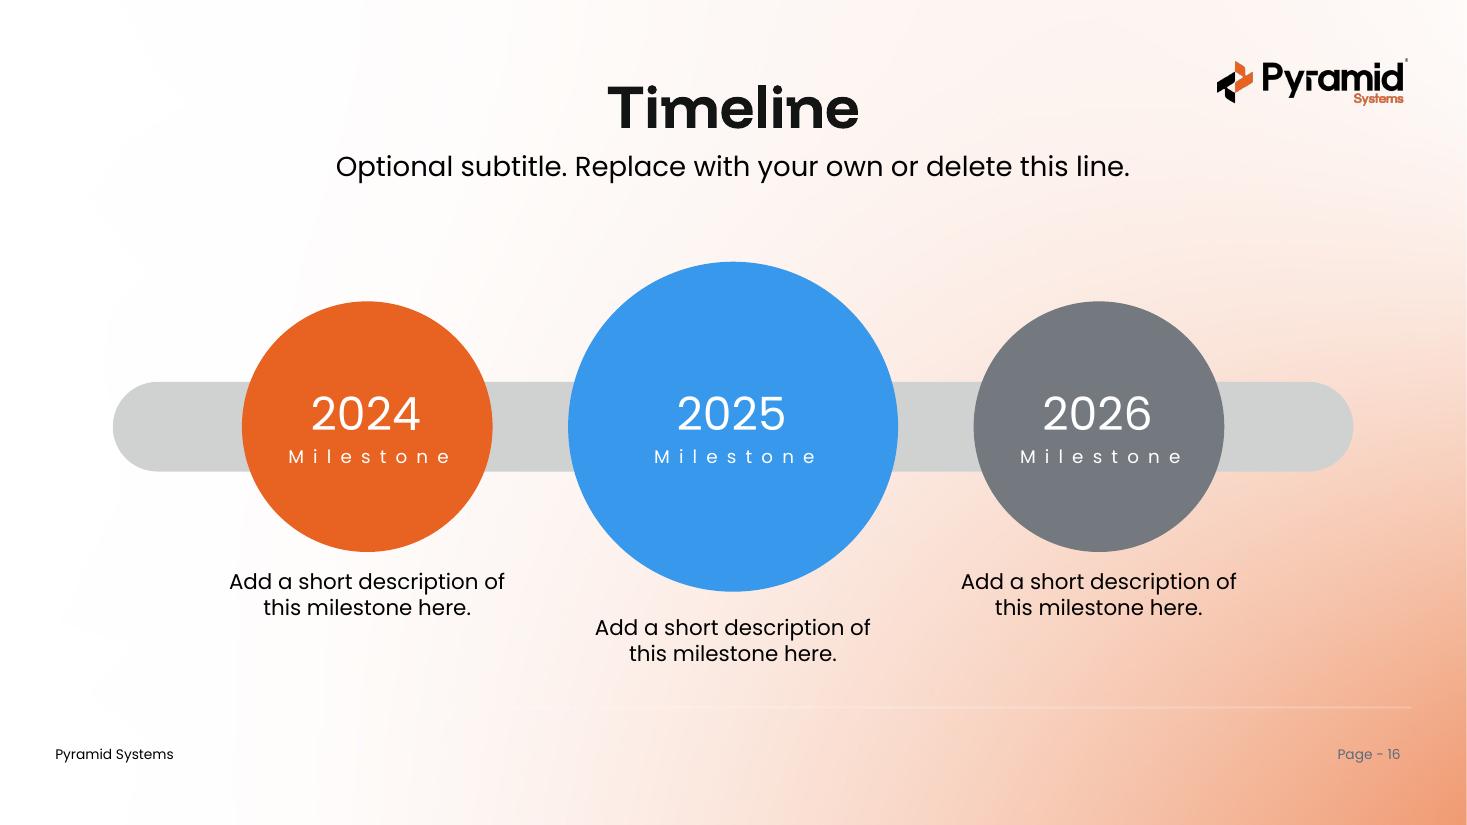
Timeline Infographics
Forty timeline designs across five visual styles — chevrons, curves, blocks, badges, and callouts. Branded, editable, and ready through 2026.
View template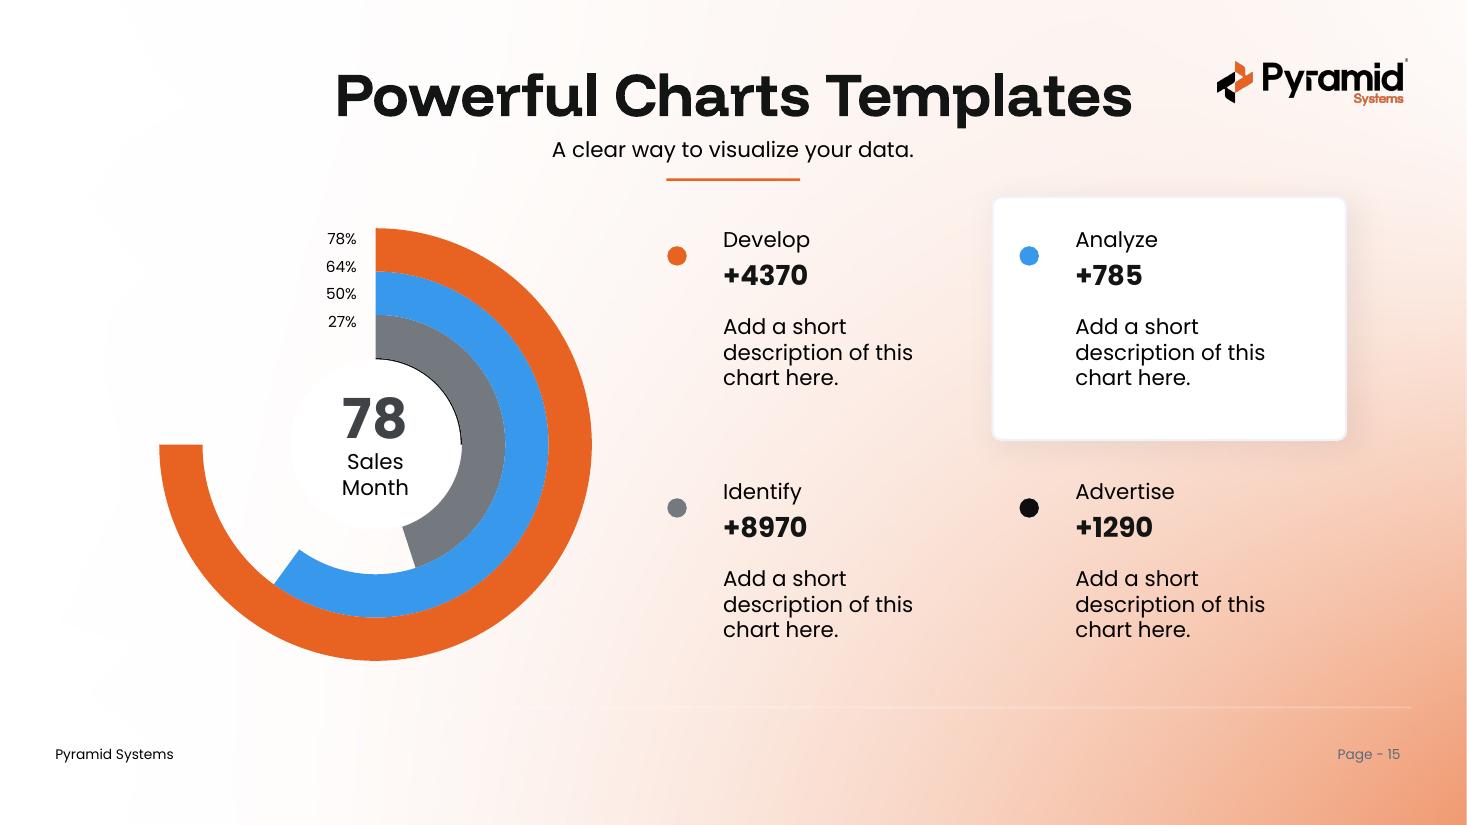
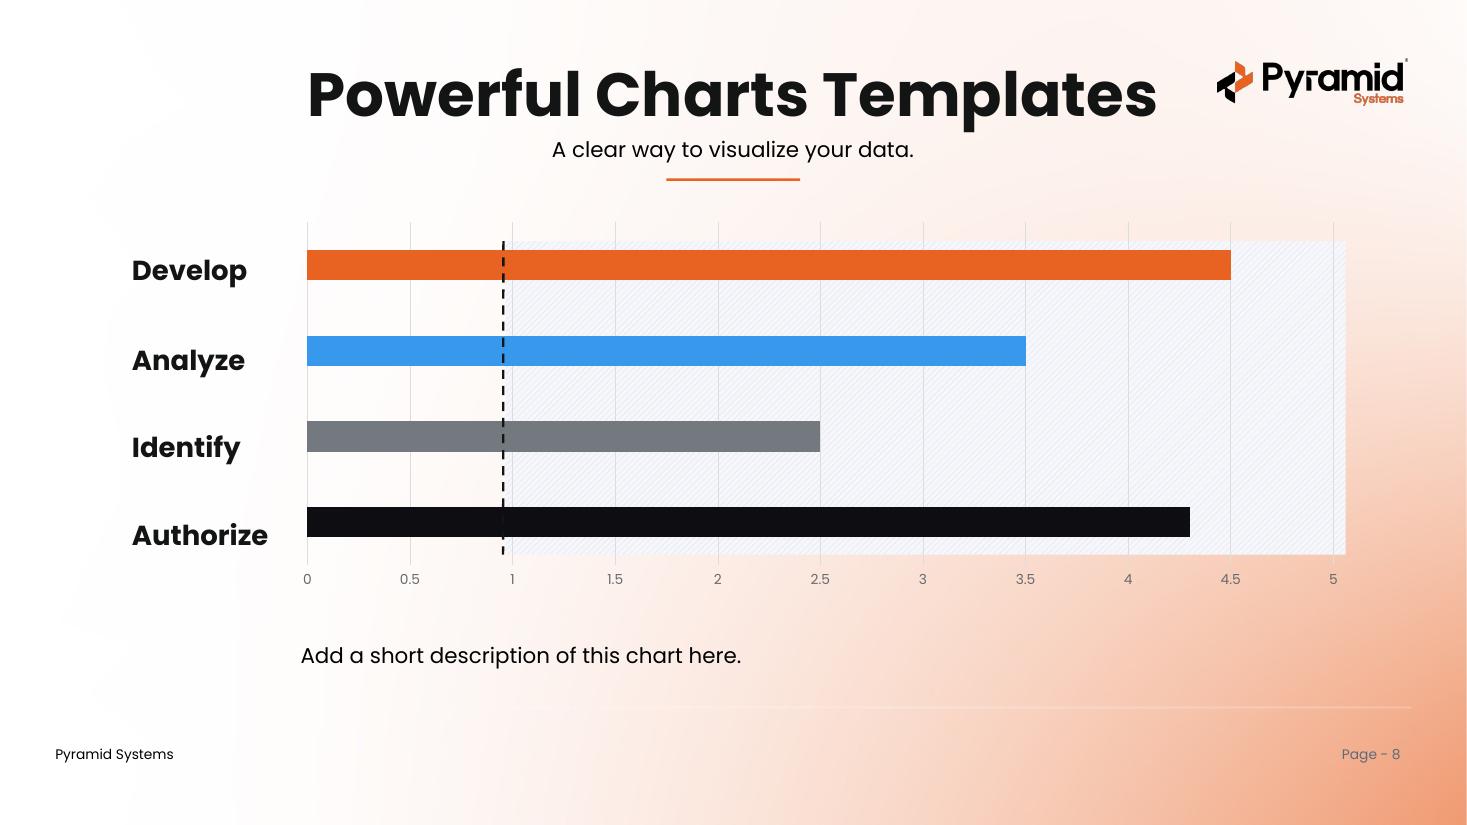
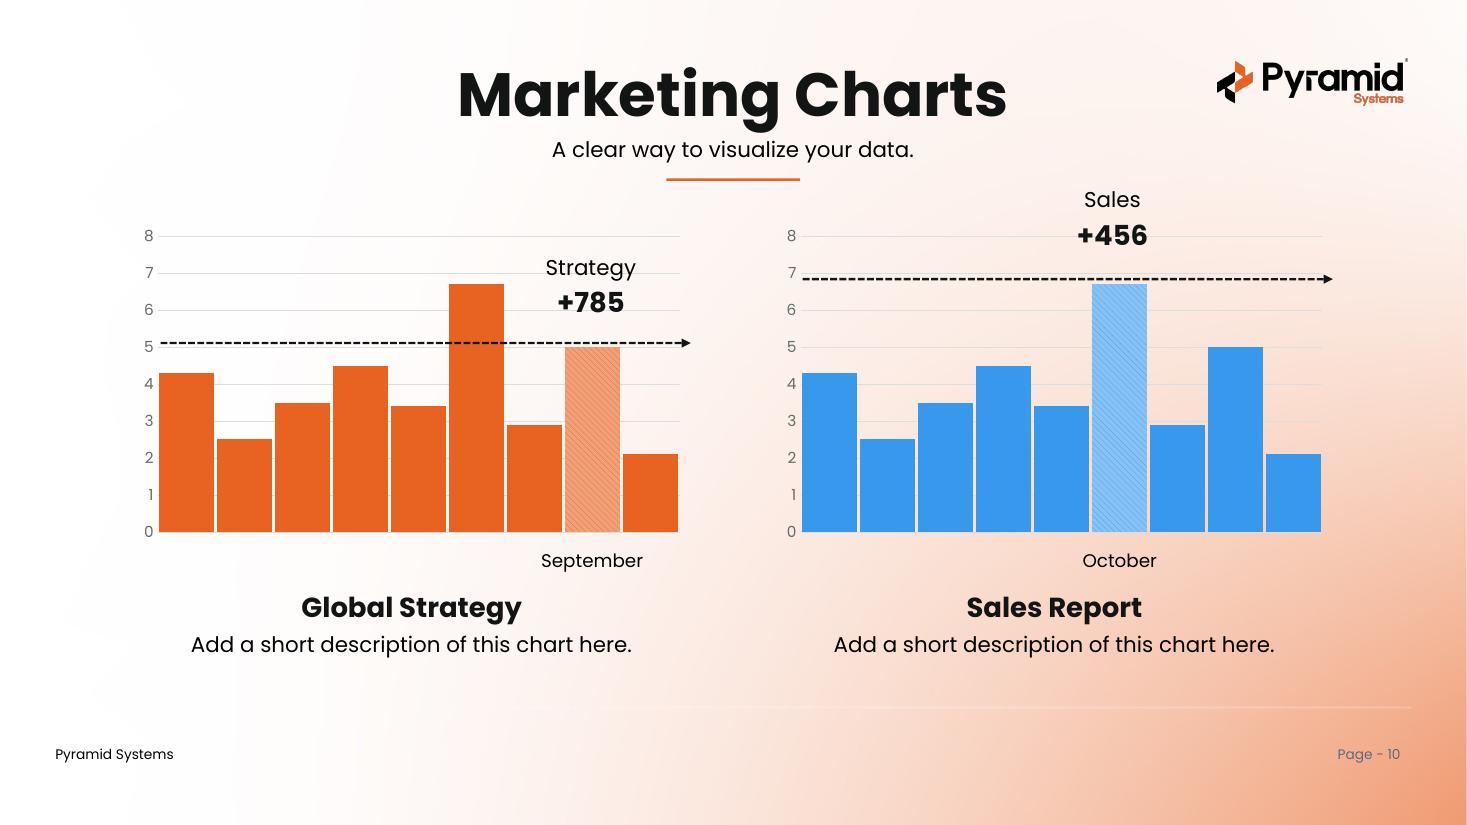
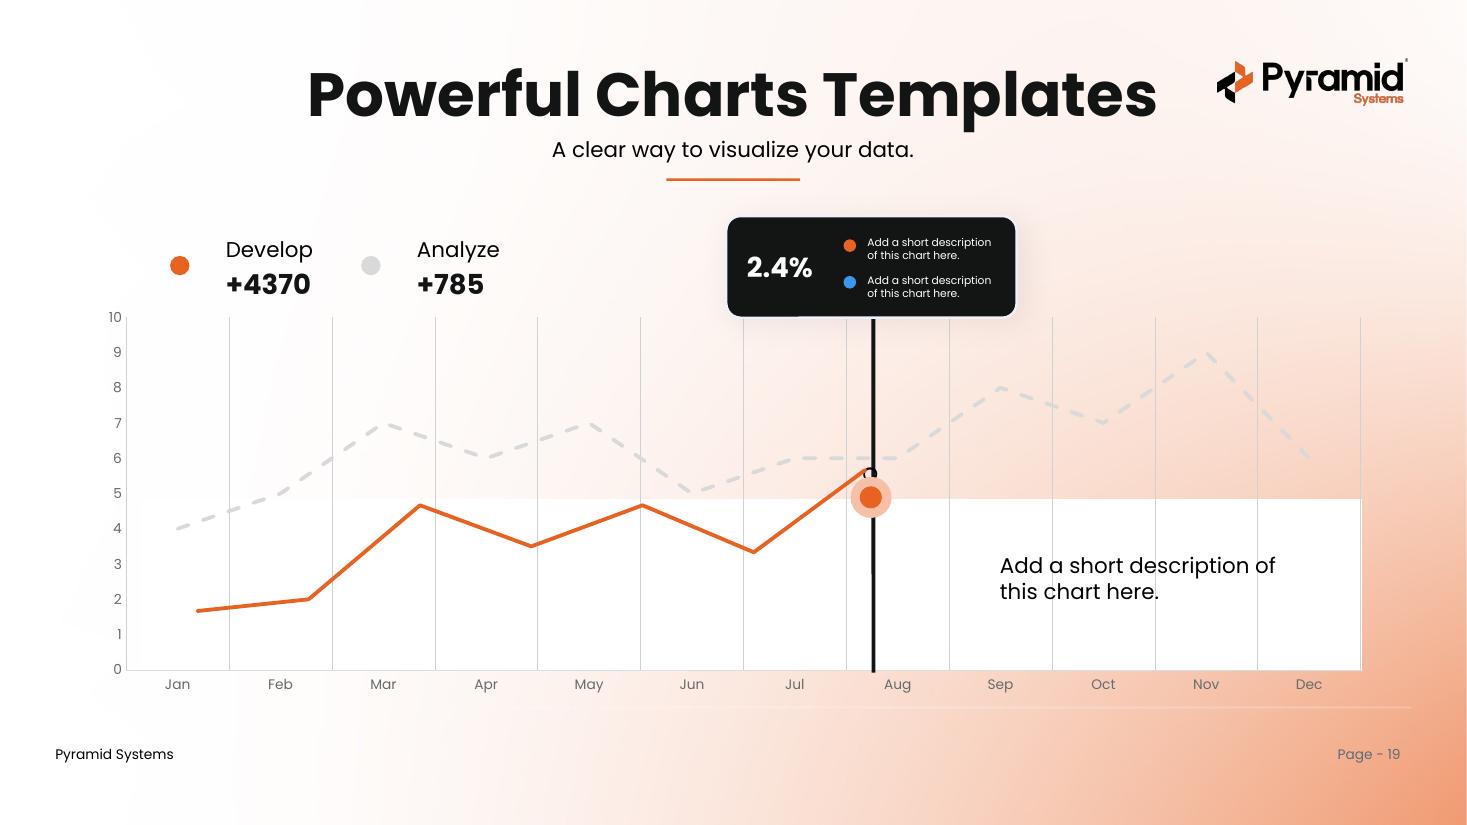
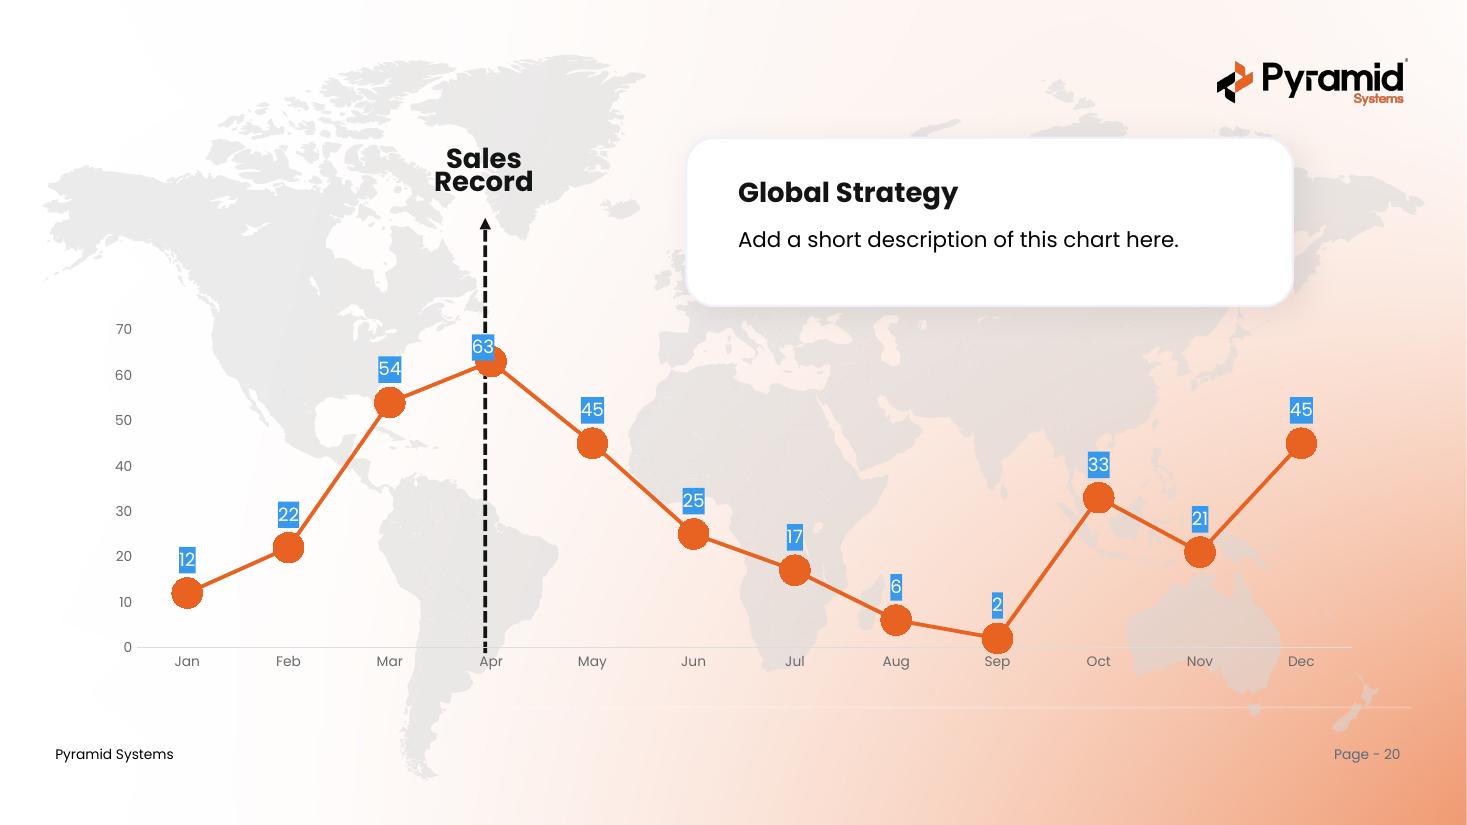
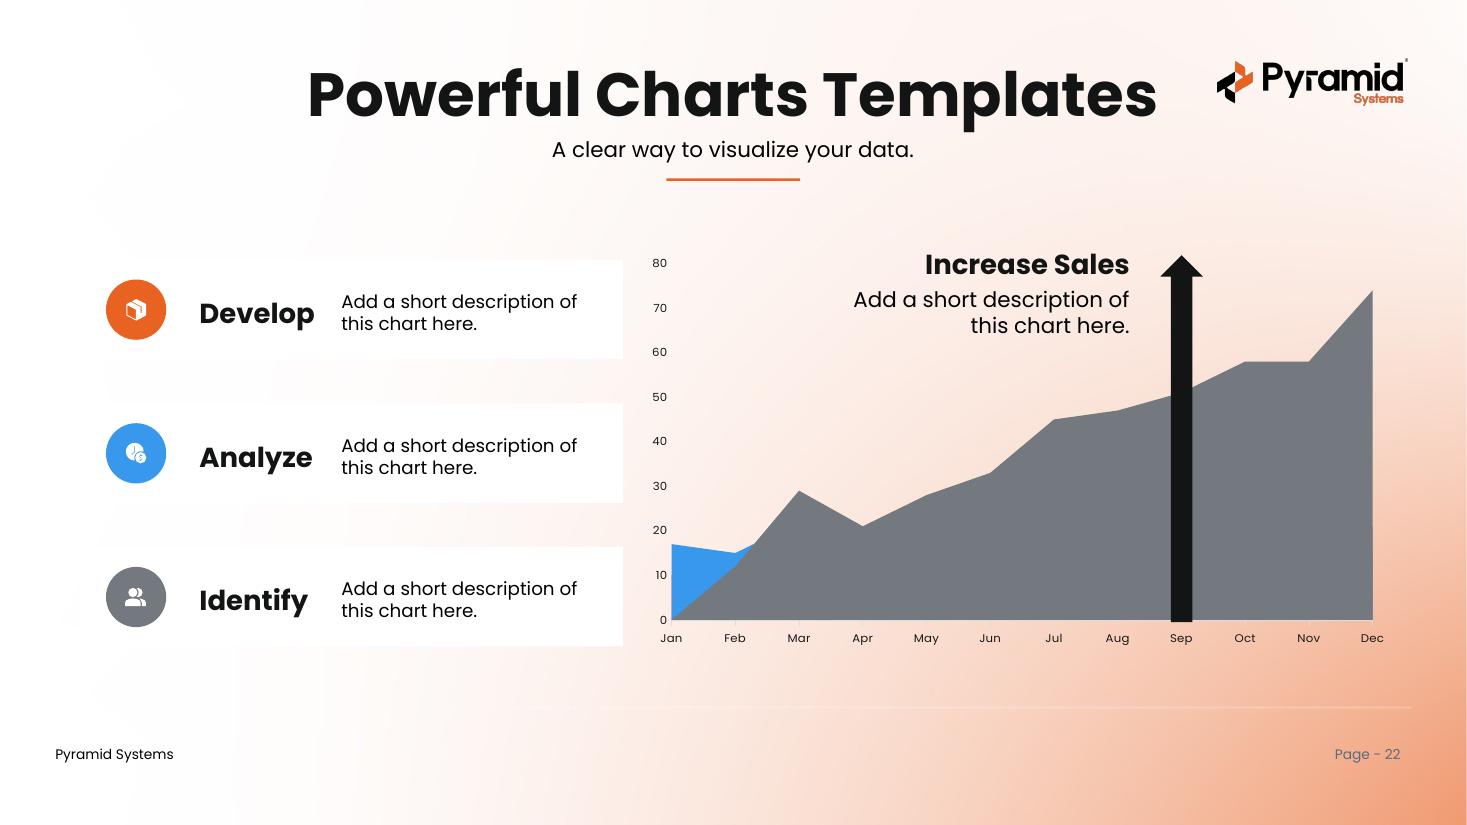
Powerful Charts
30+ branded, fully editable charts — bar, pie, line, area, radar, and bubble. Copy one in and drop in your own data.
View template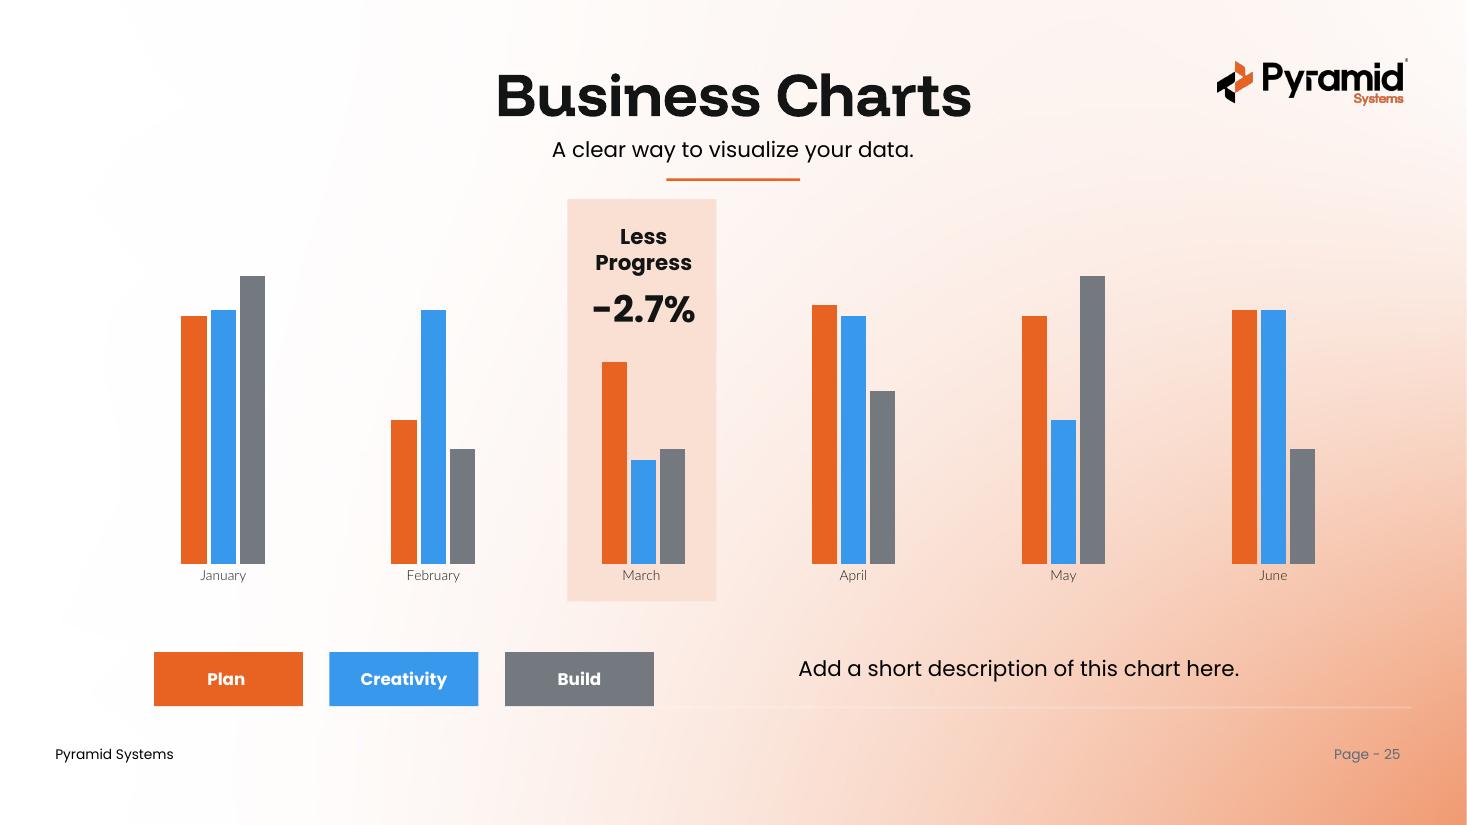
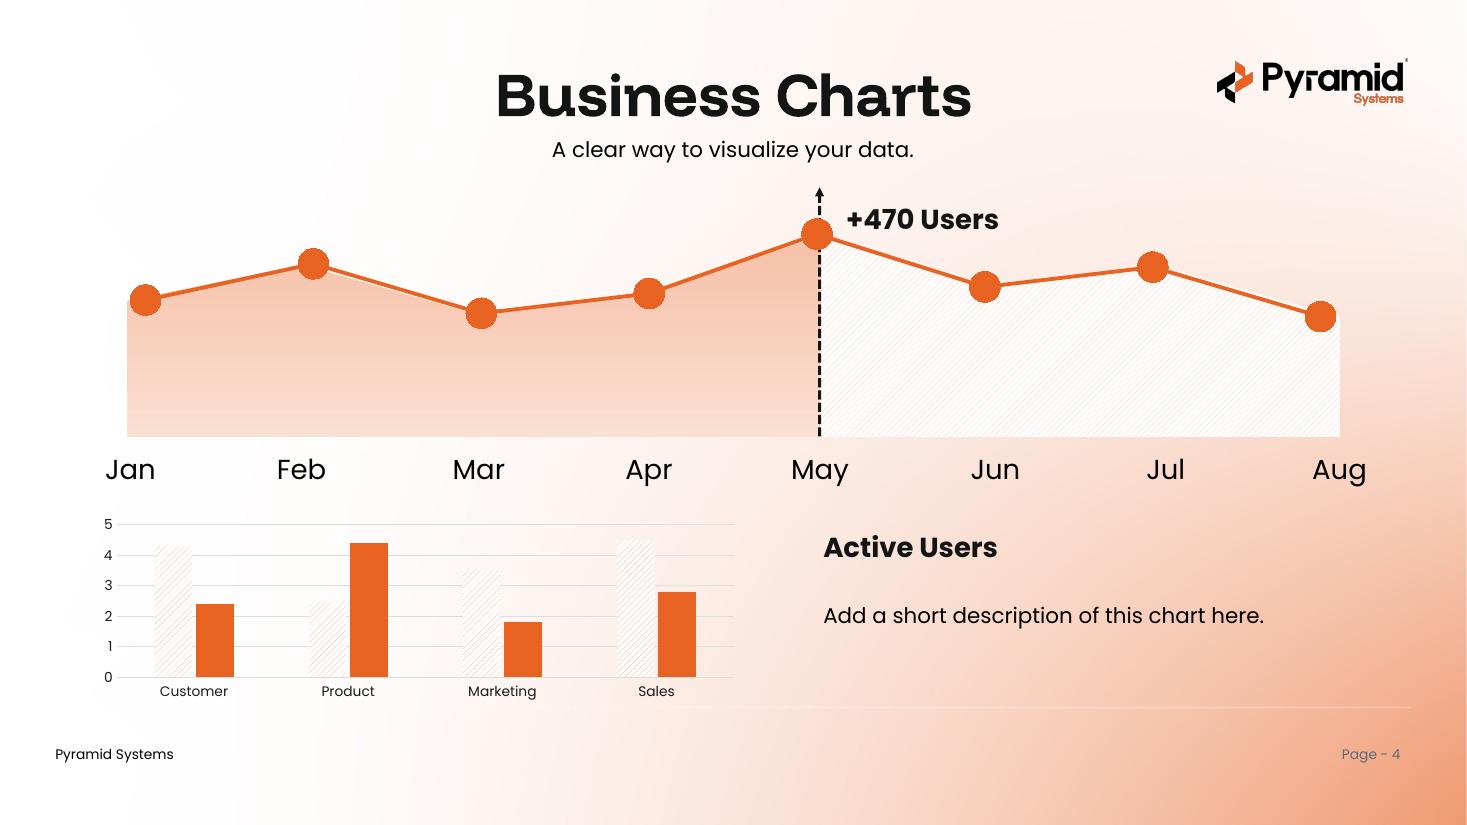
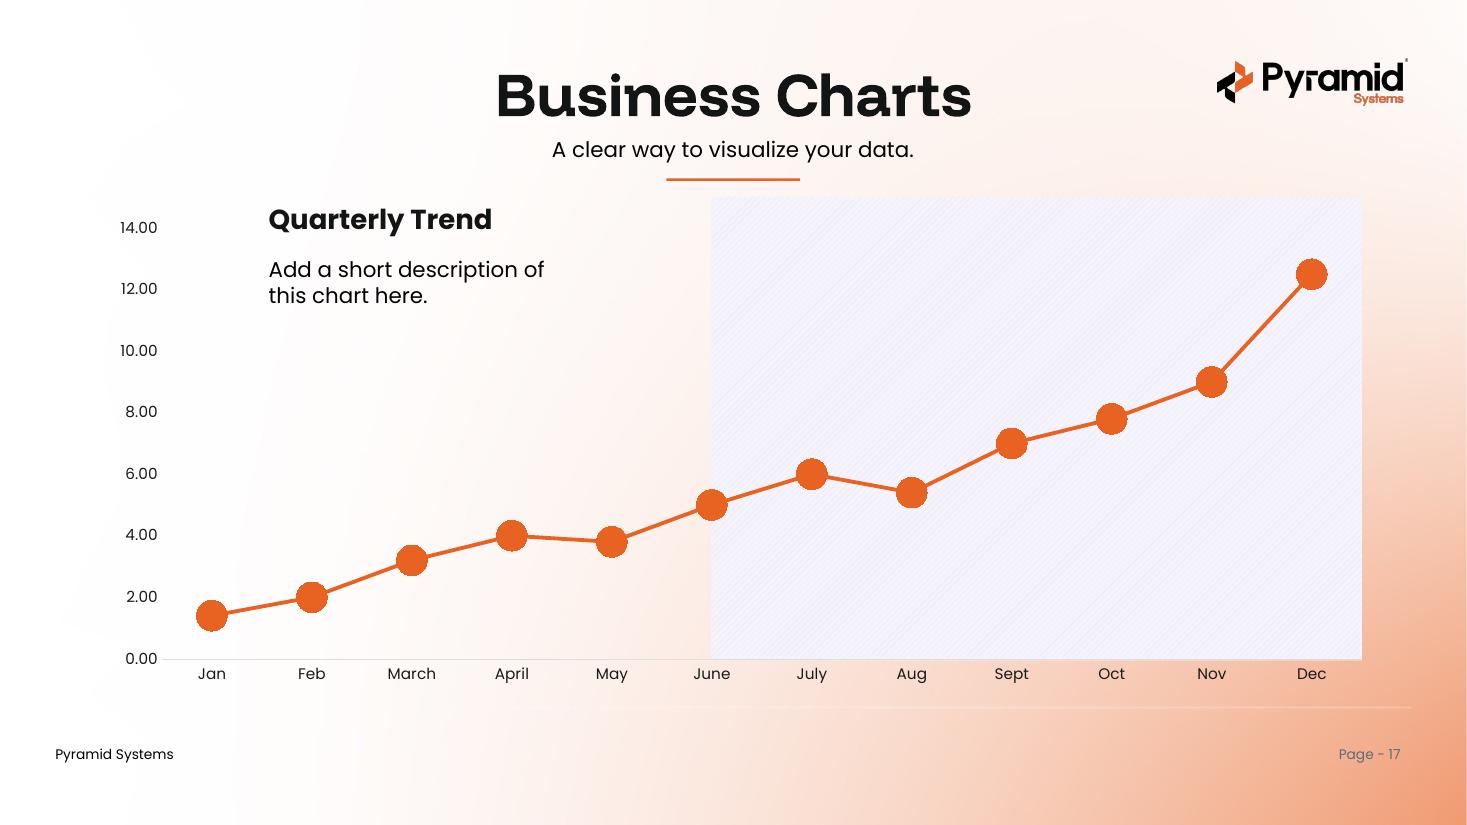
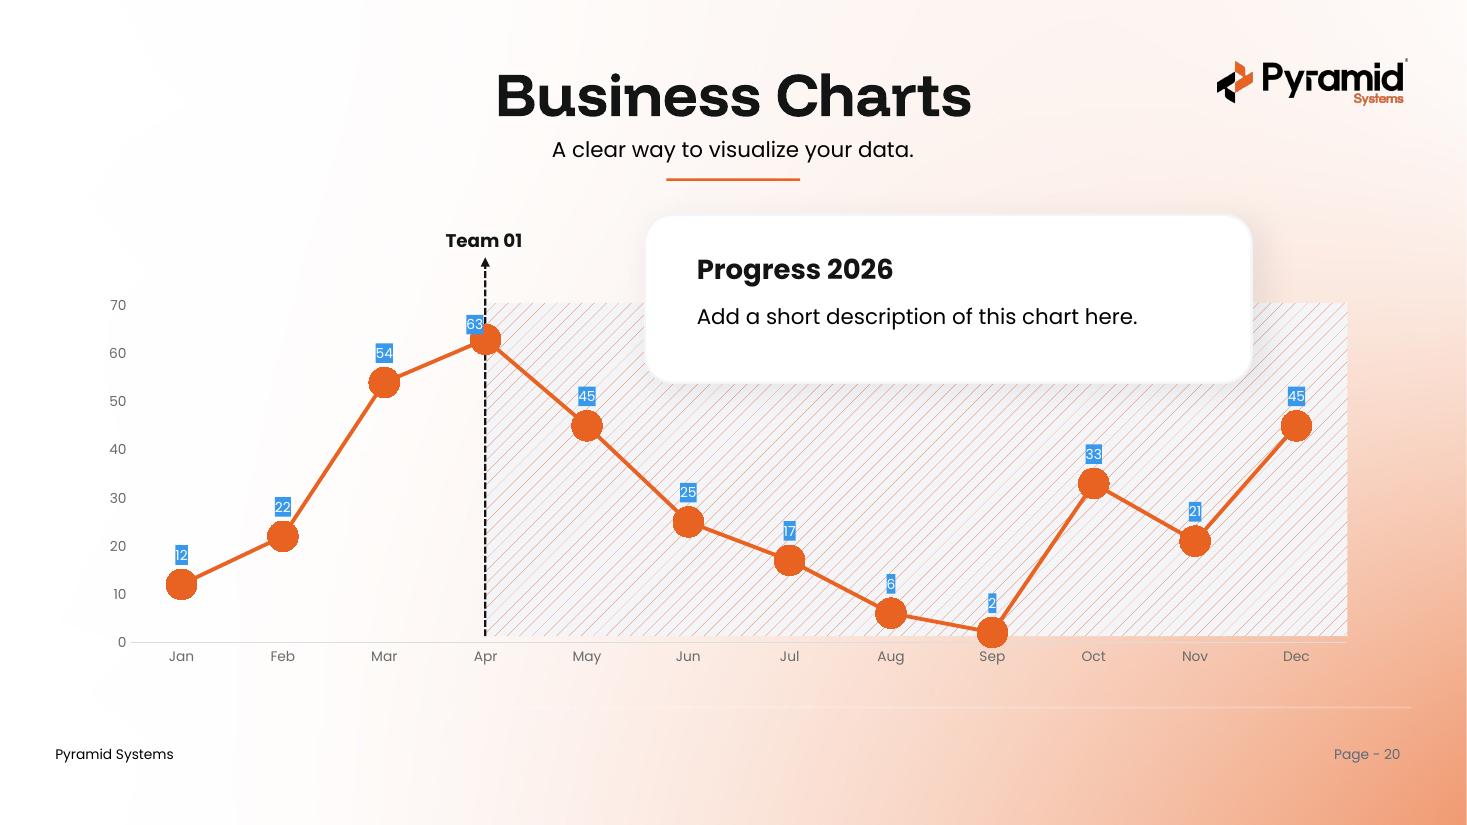
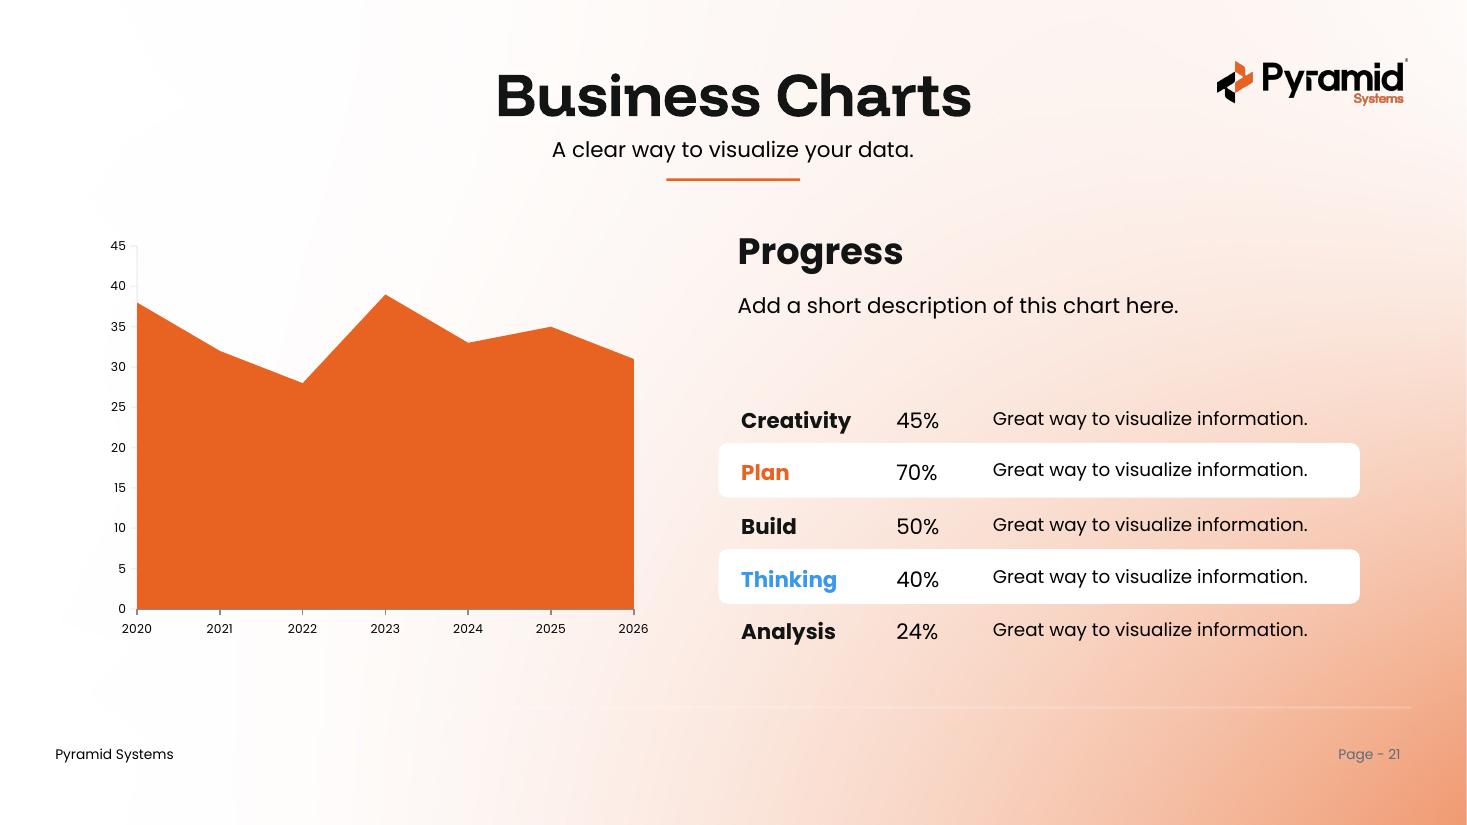
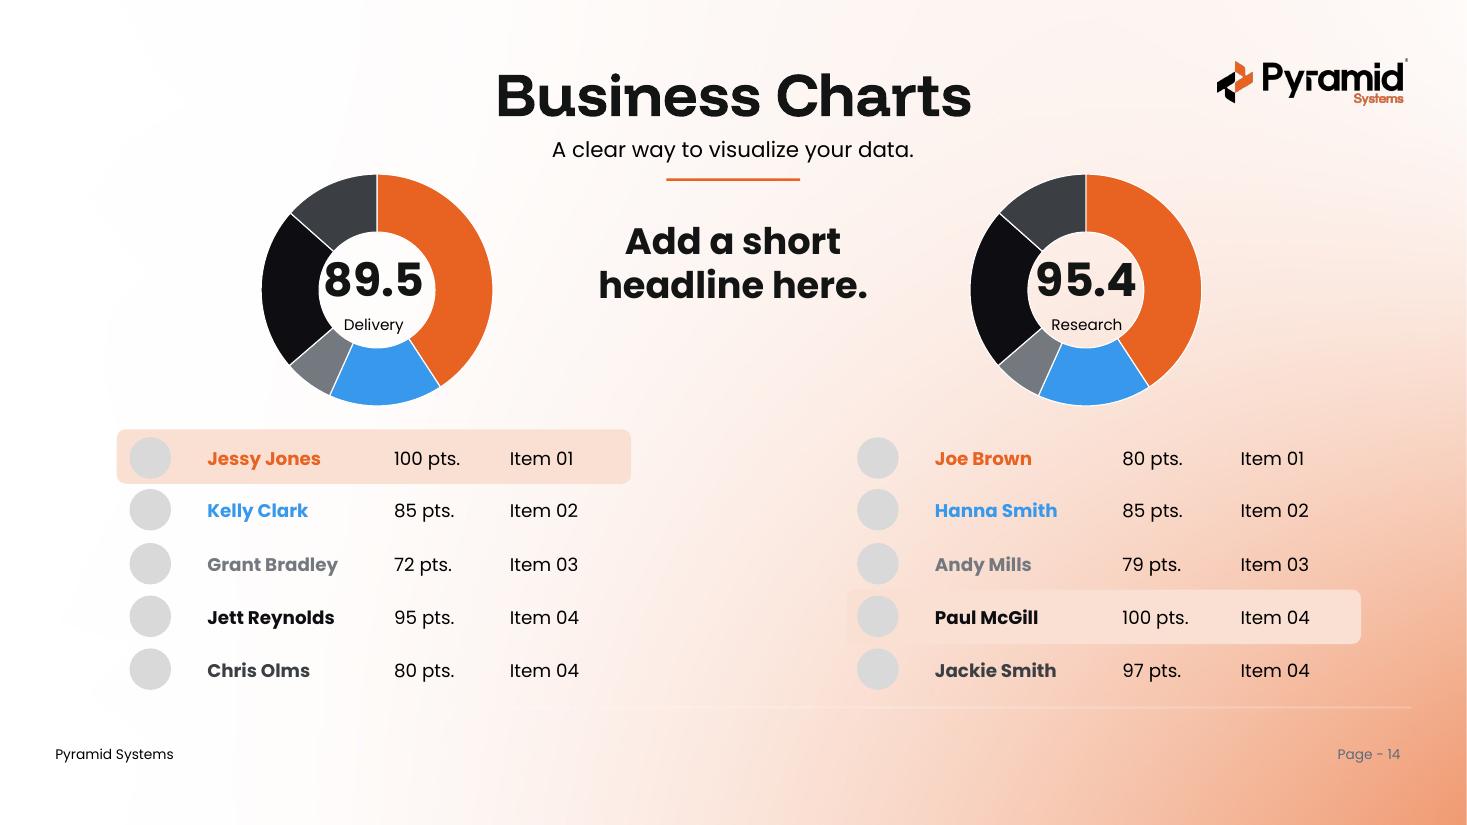
Business Charts
20 branded, editable charts — bar, column, line, area, donut, and KPI visuals. Copy one in and drop in your own data.
View template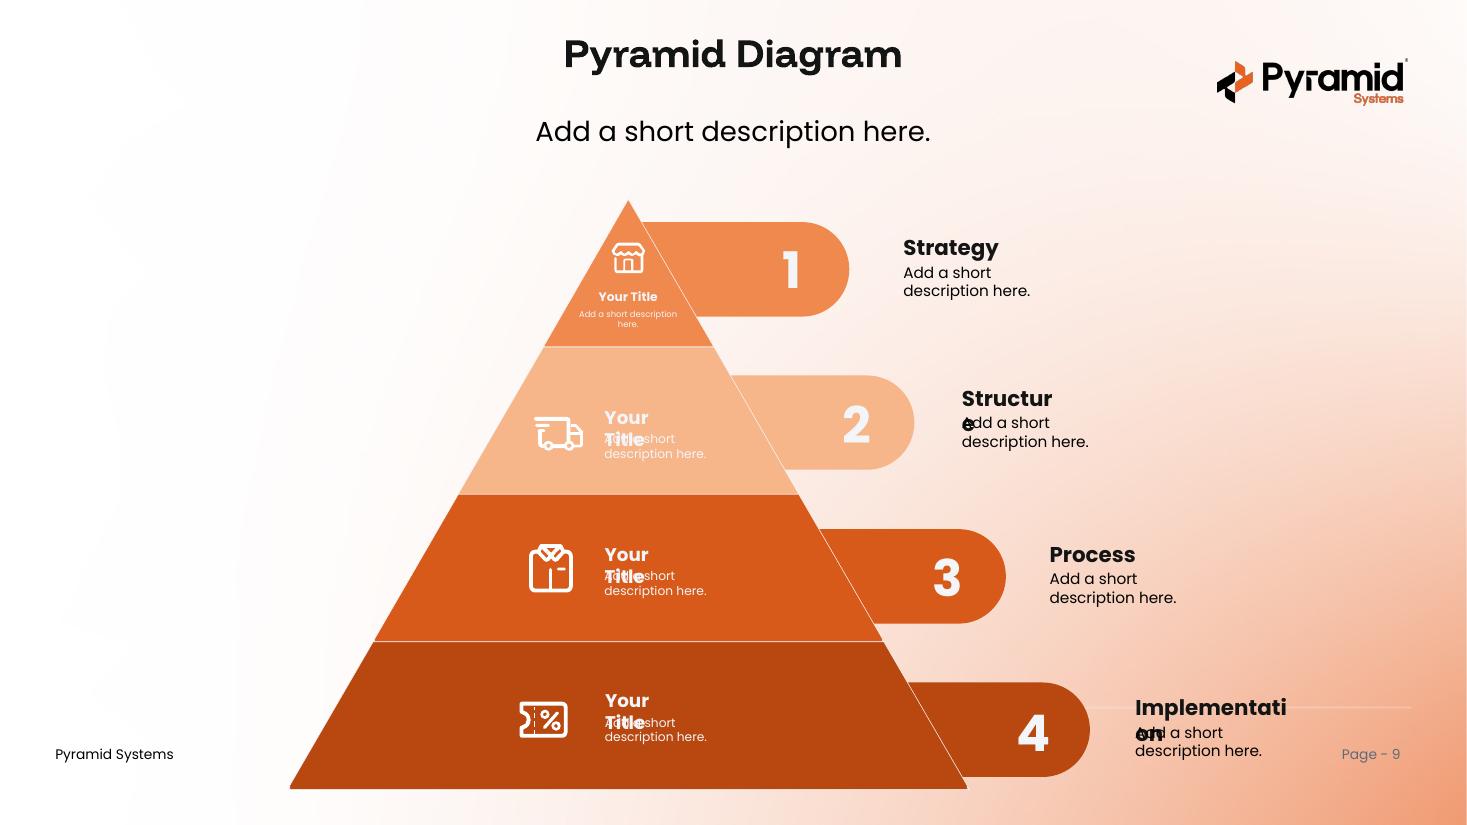
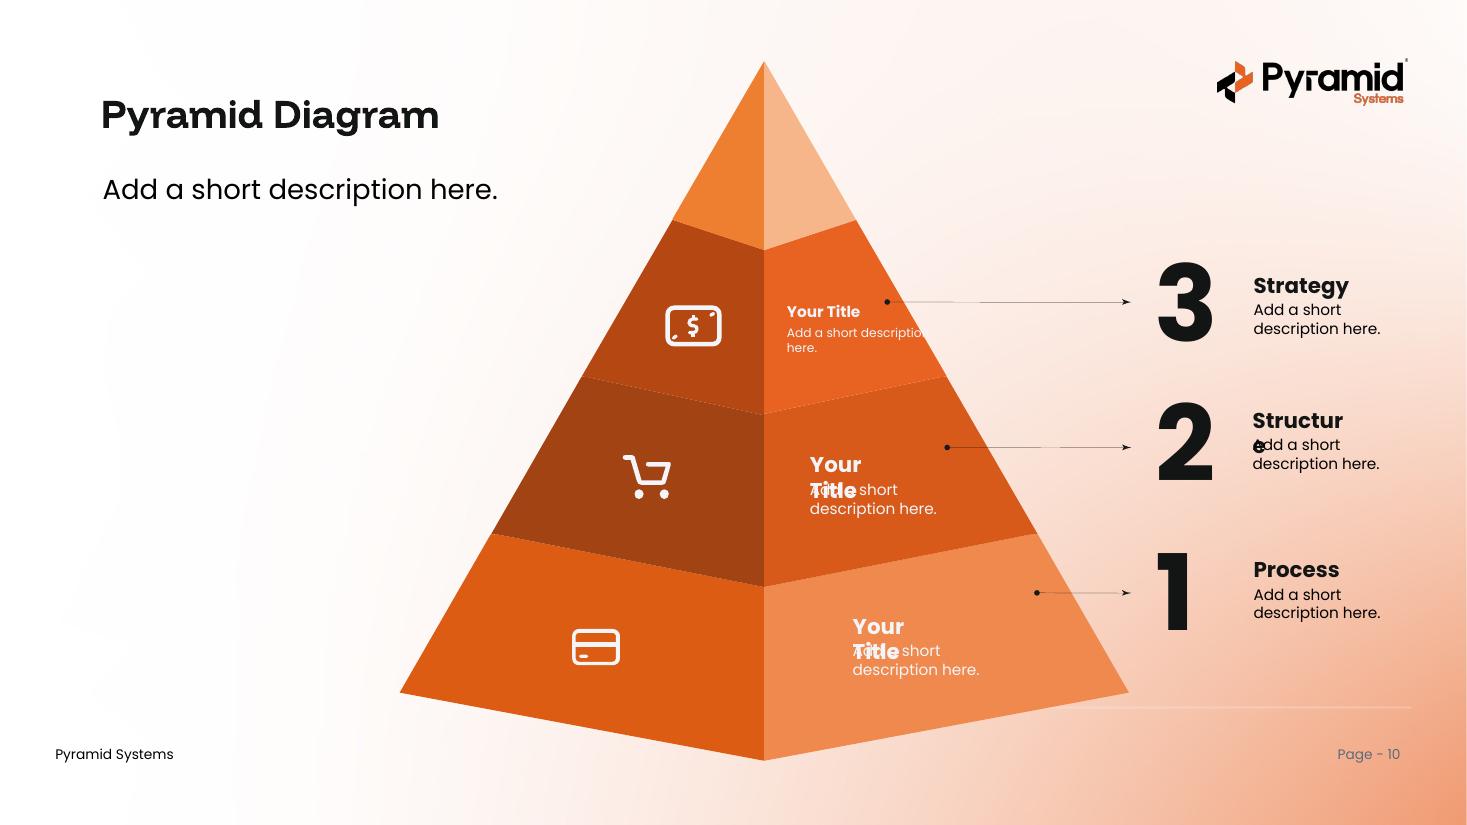
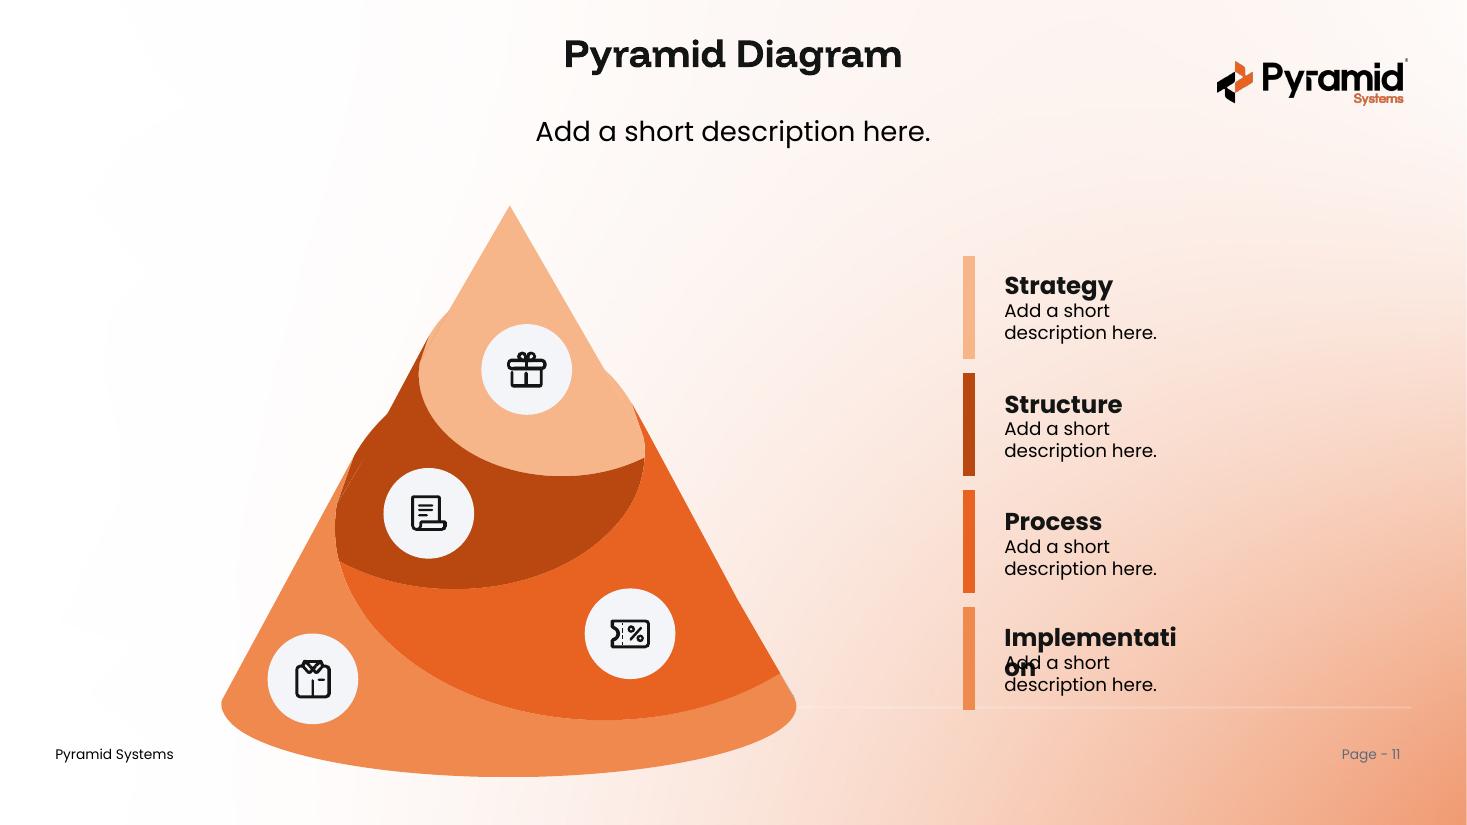
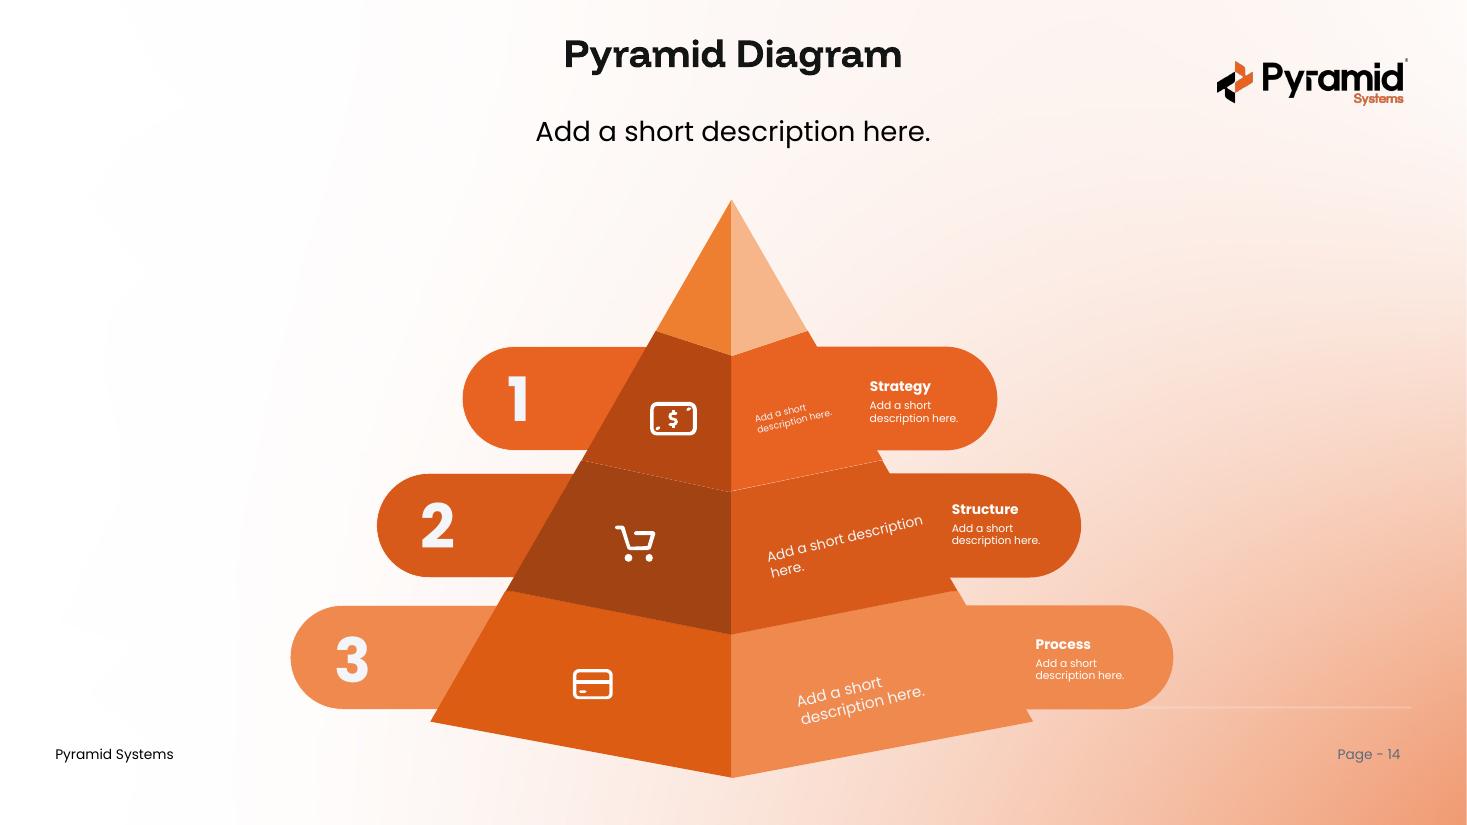
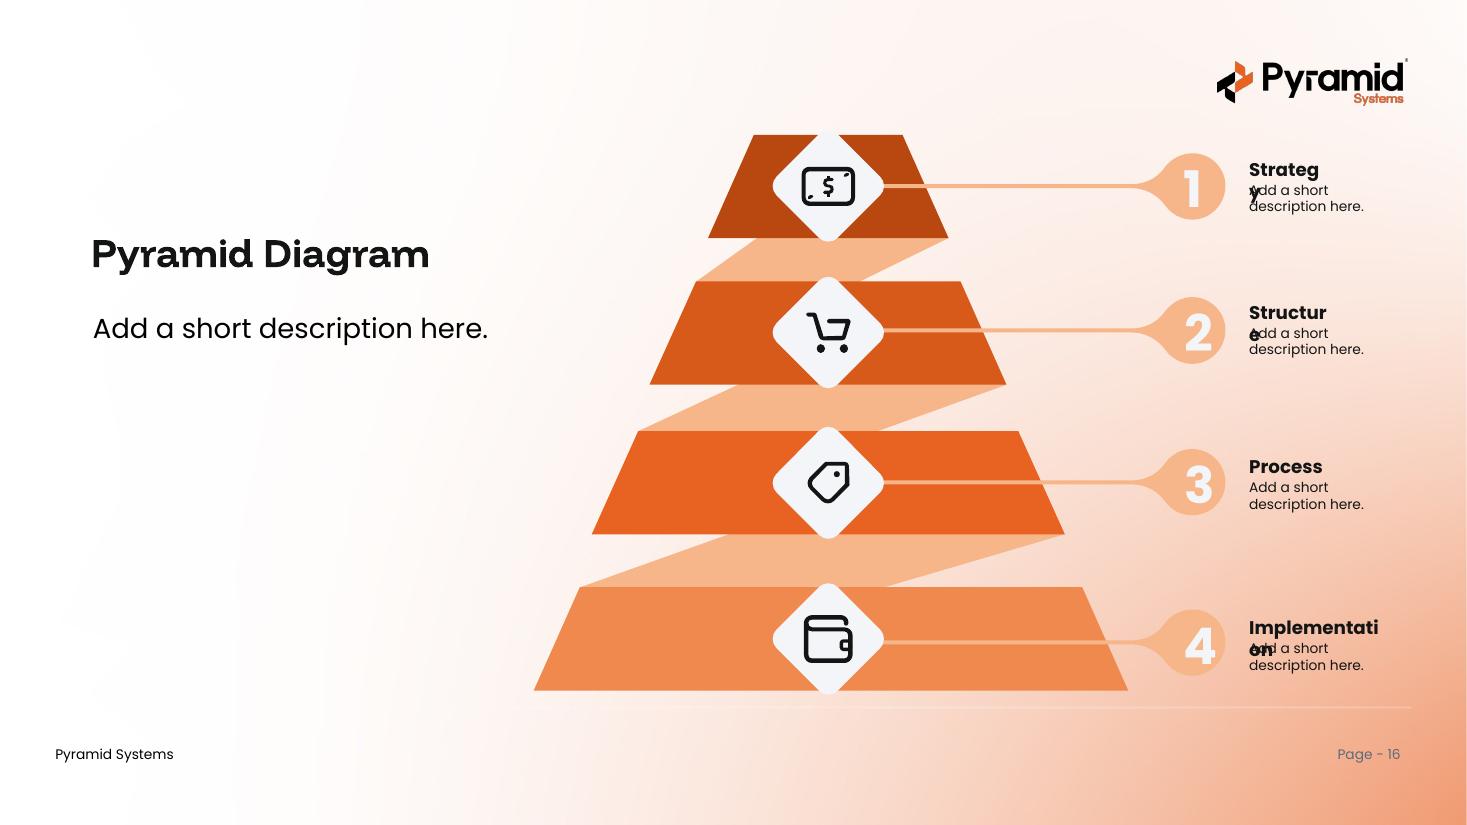
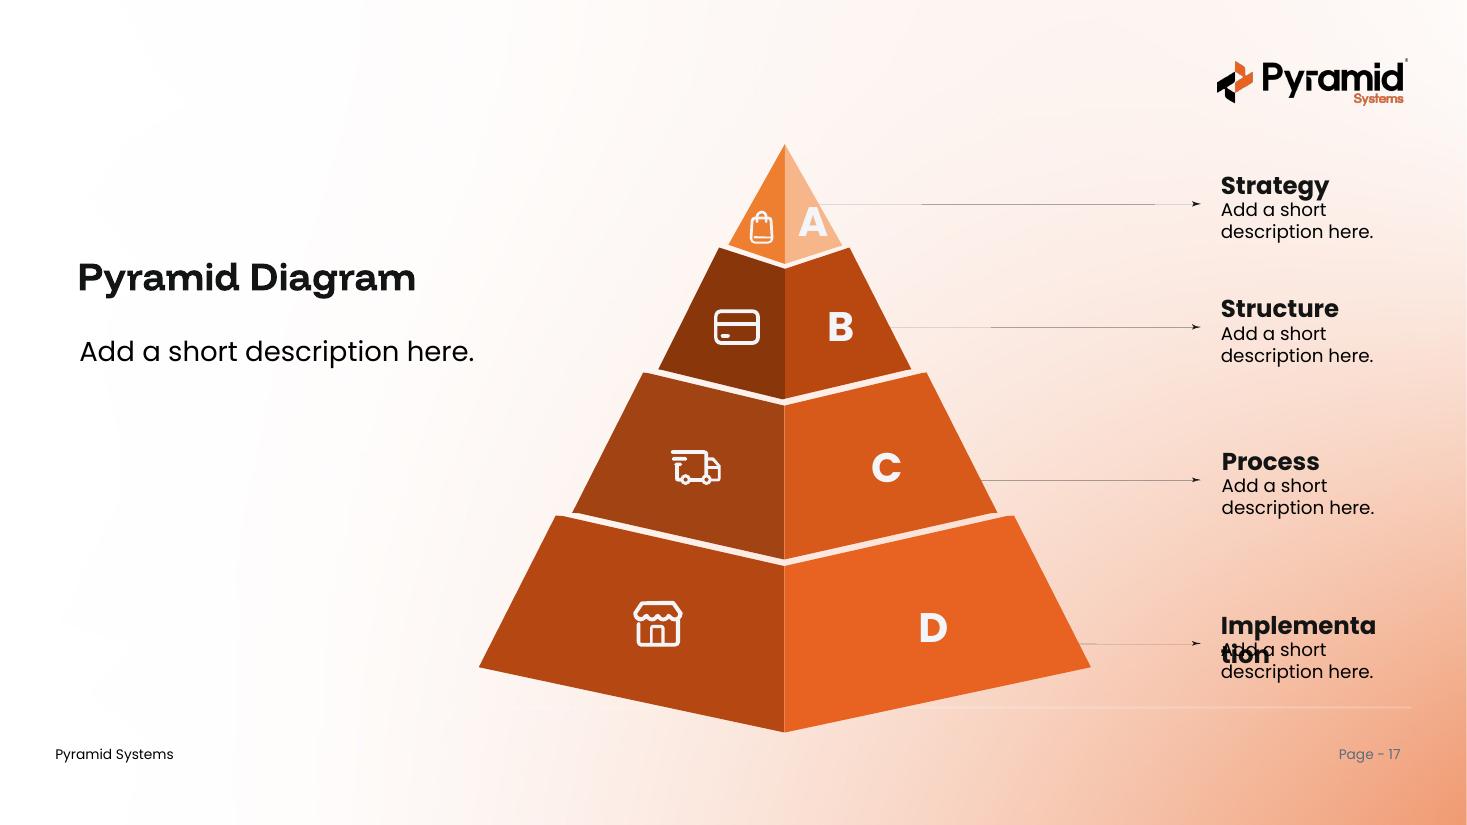
Pyramid Diagrams
16 branded, editable pyramid layouts — layered, 3D, cones, and callouts. Copy one in and drop in your own labels.
View template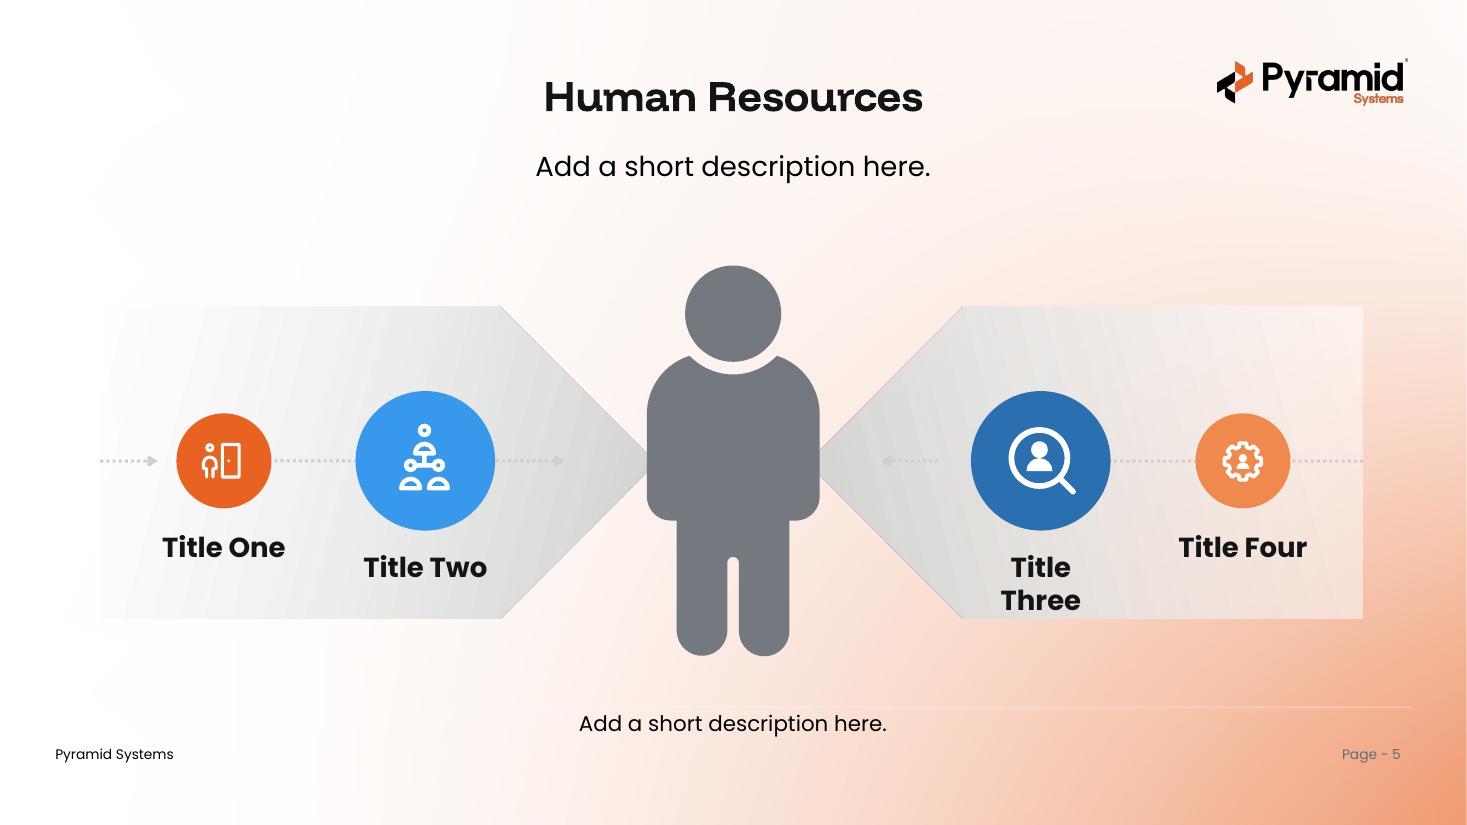
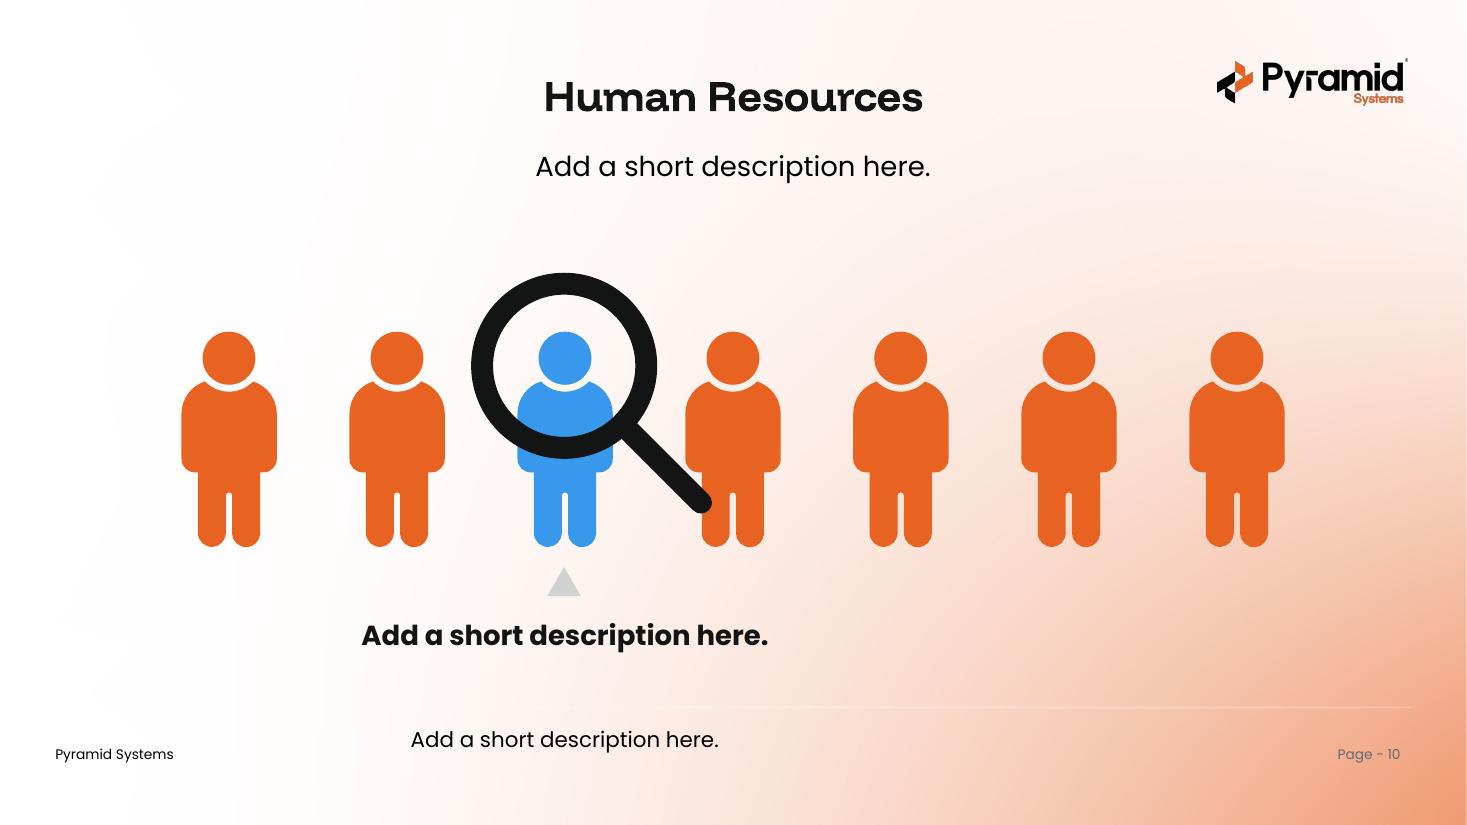
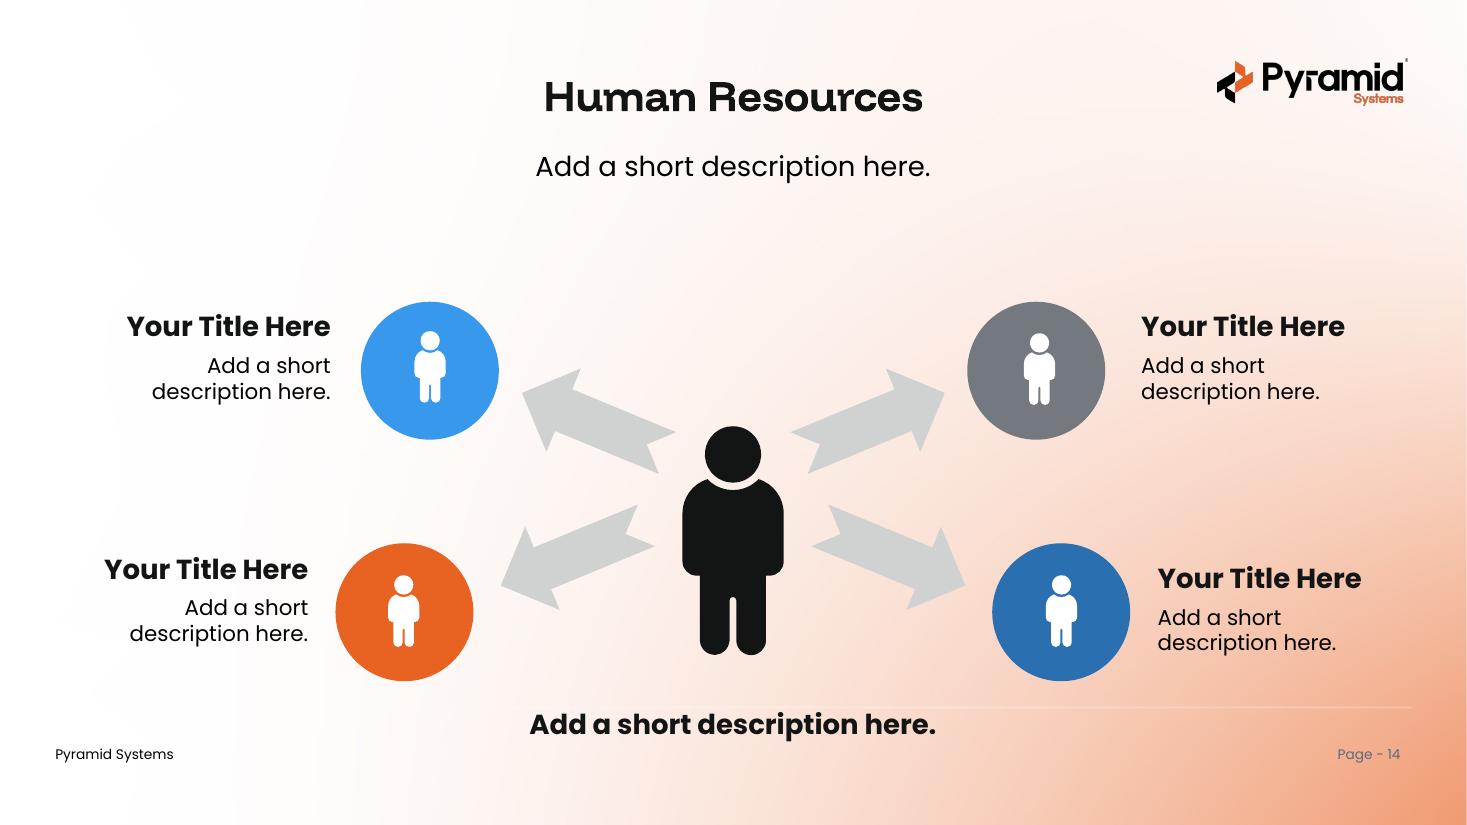
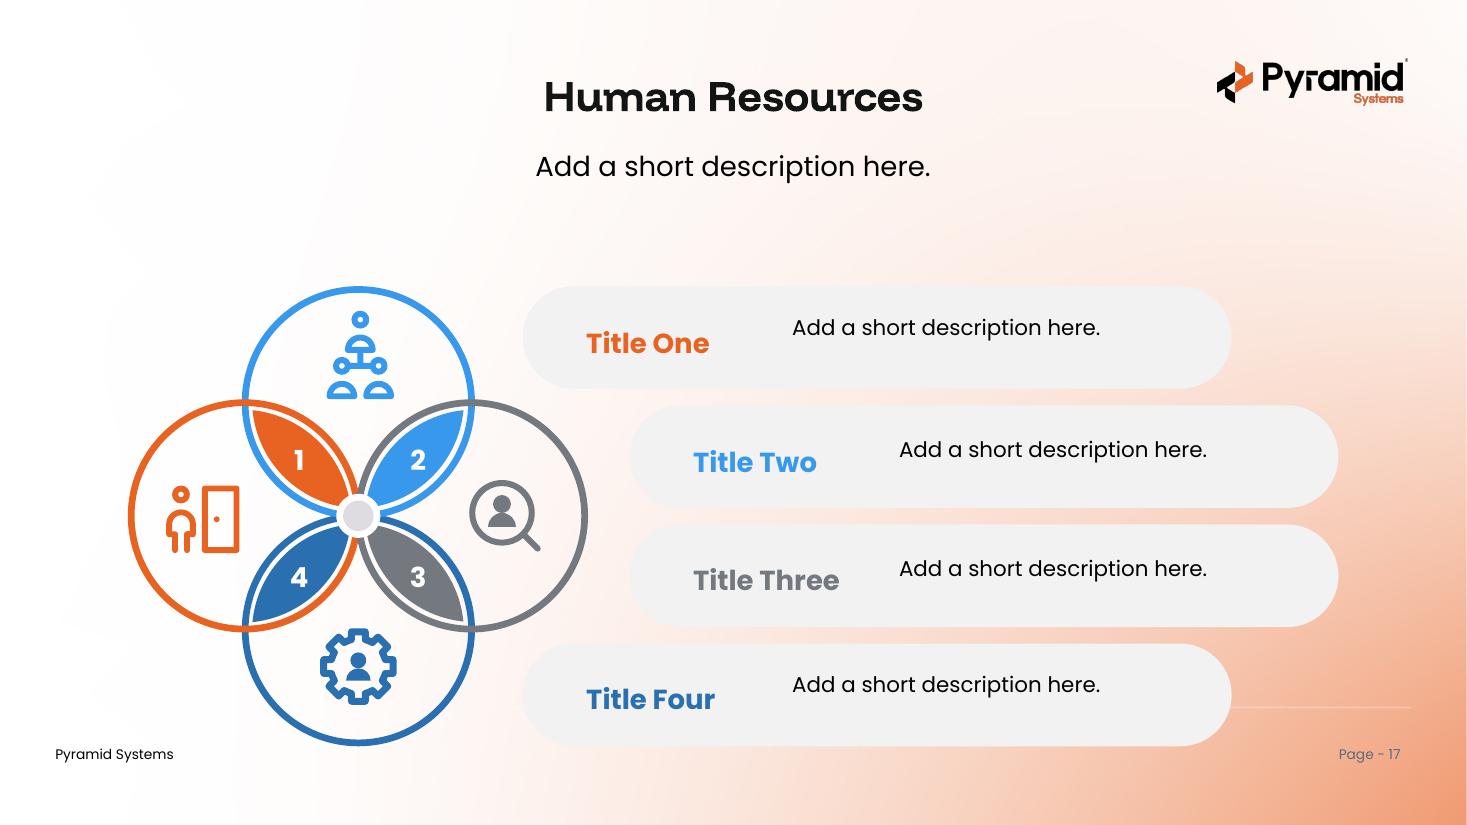
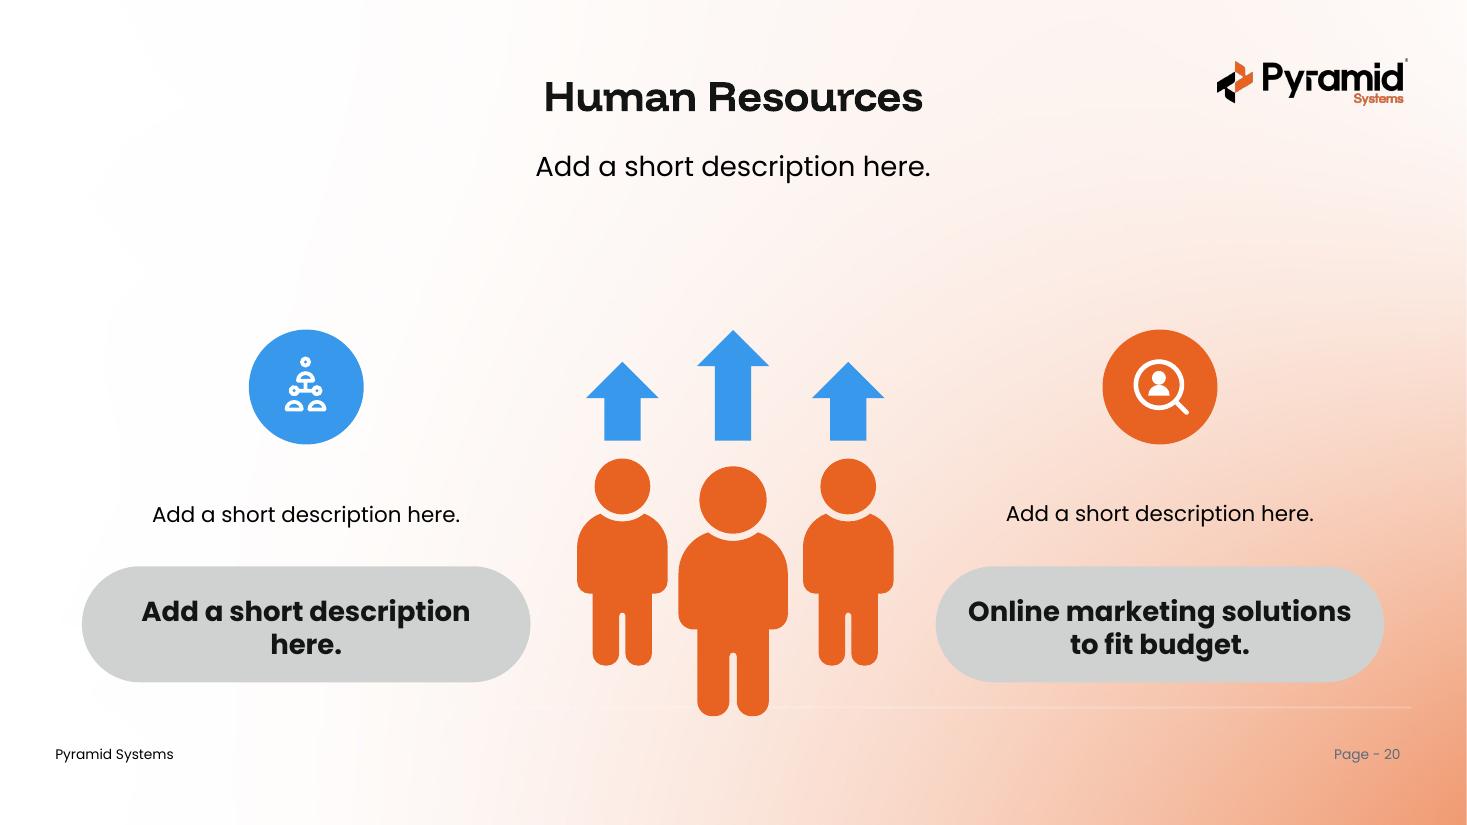
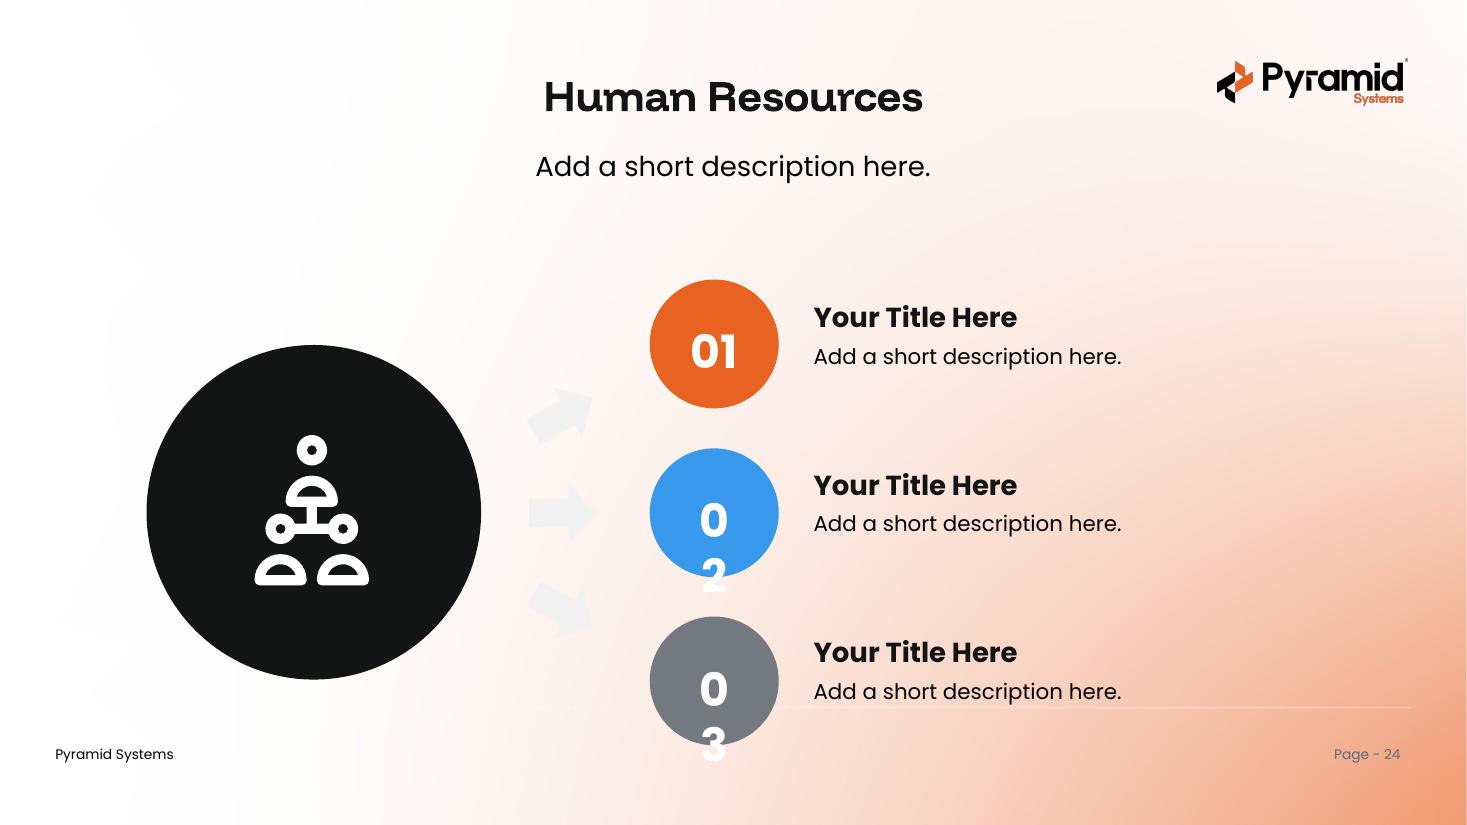
Human Resources
20 branded, editable HR infographics — teams, comparisons, process flows, and lists. Copy one in and drop in your own labels.
View template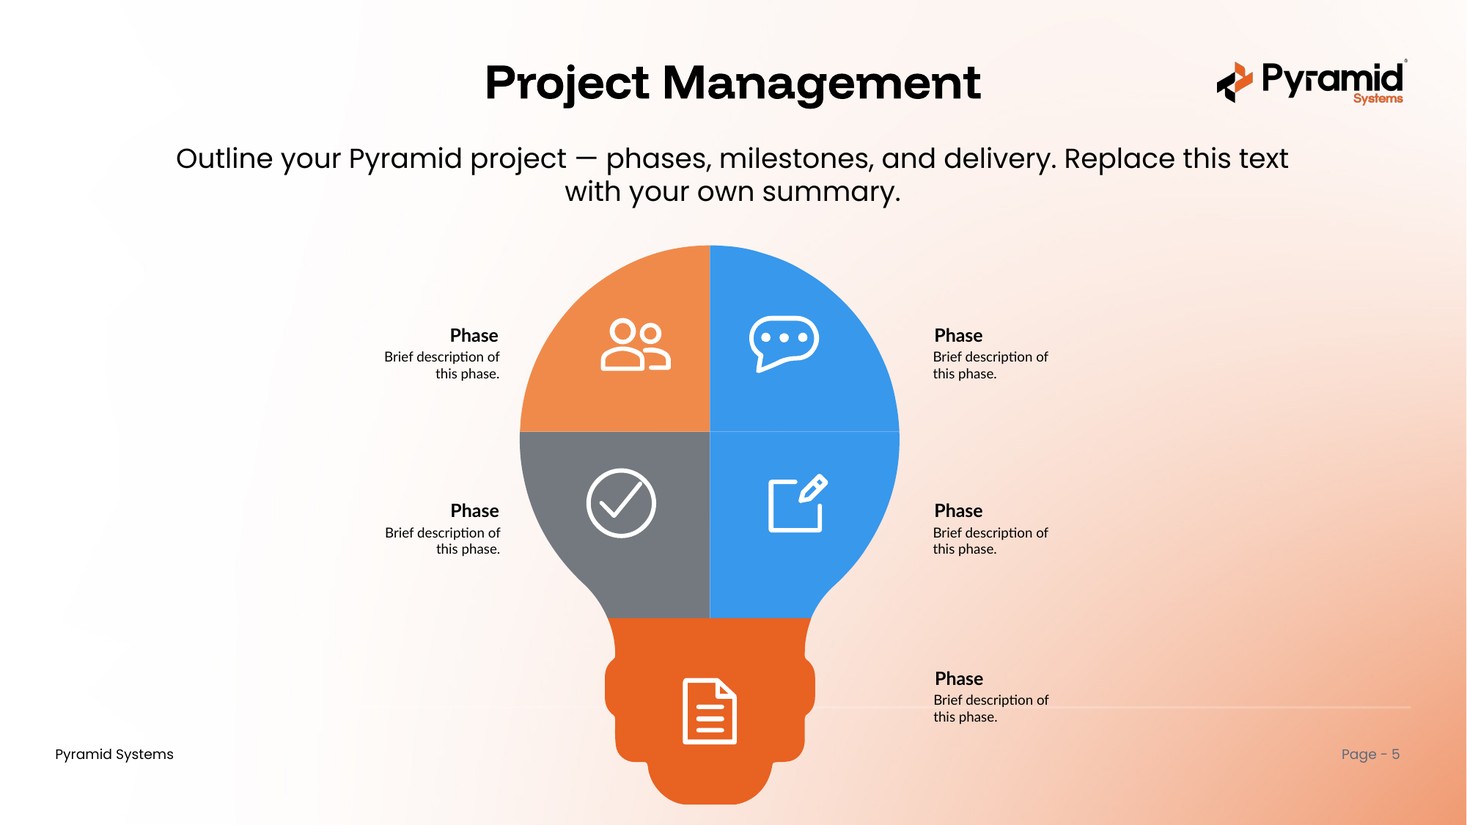
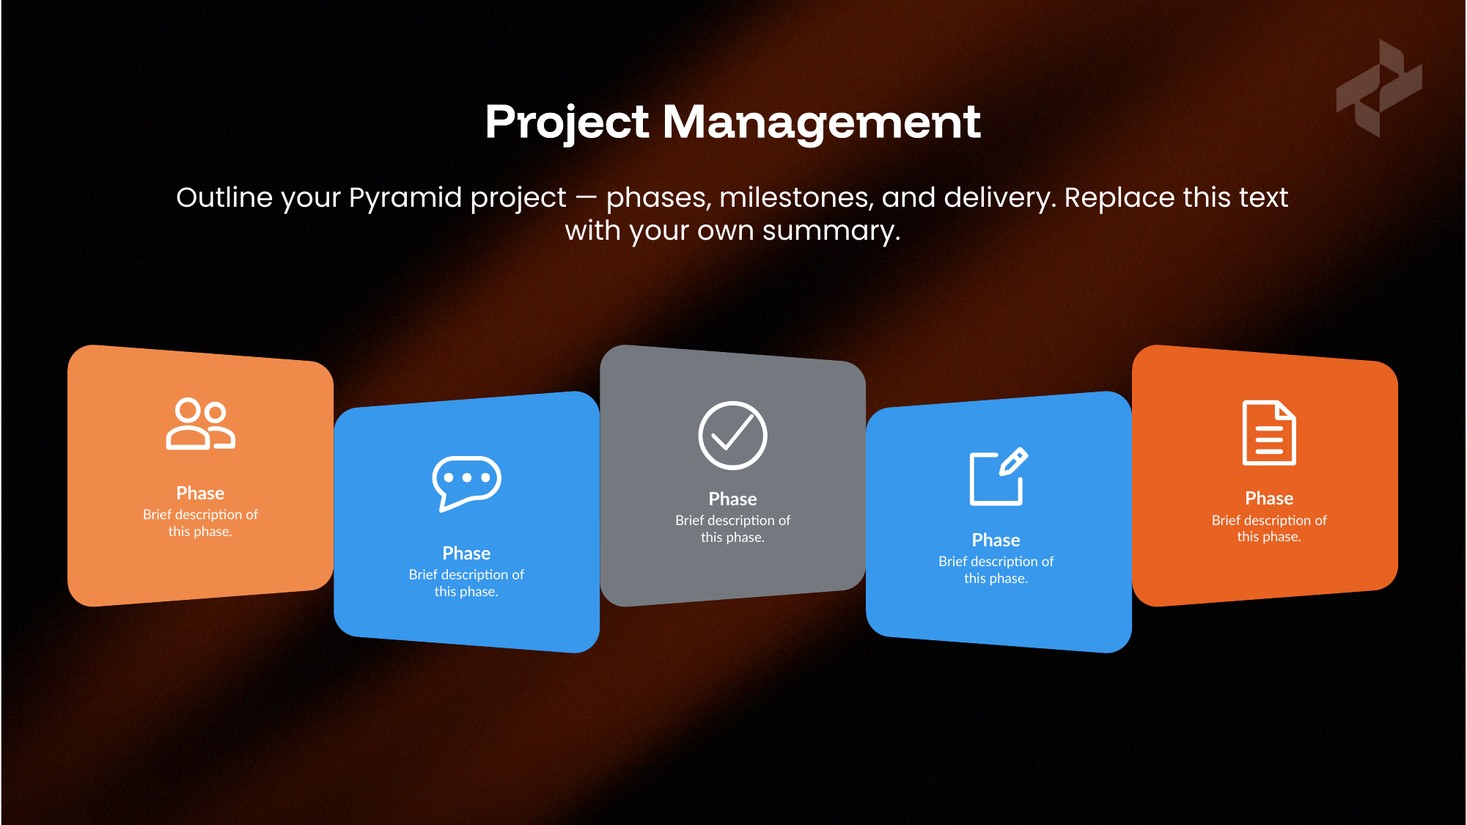
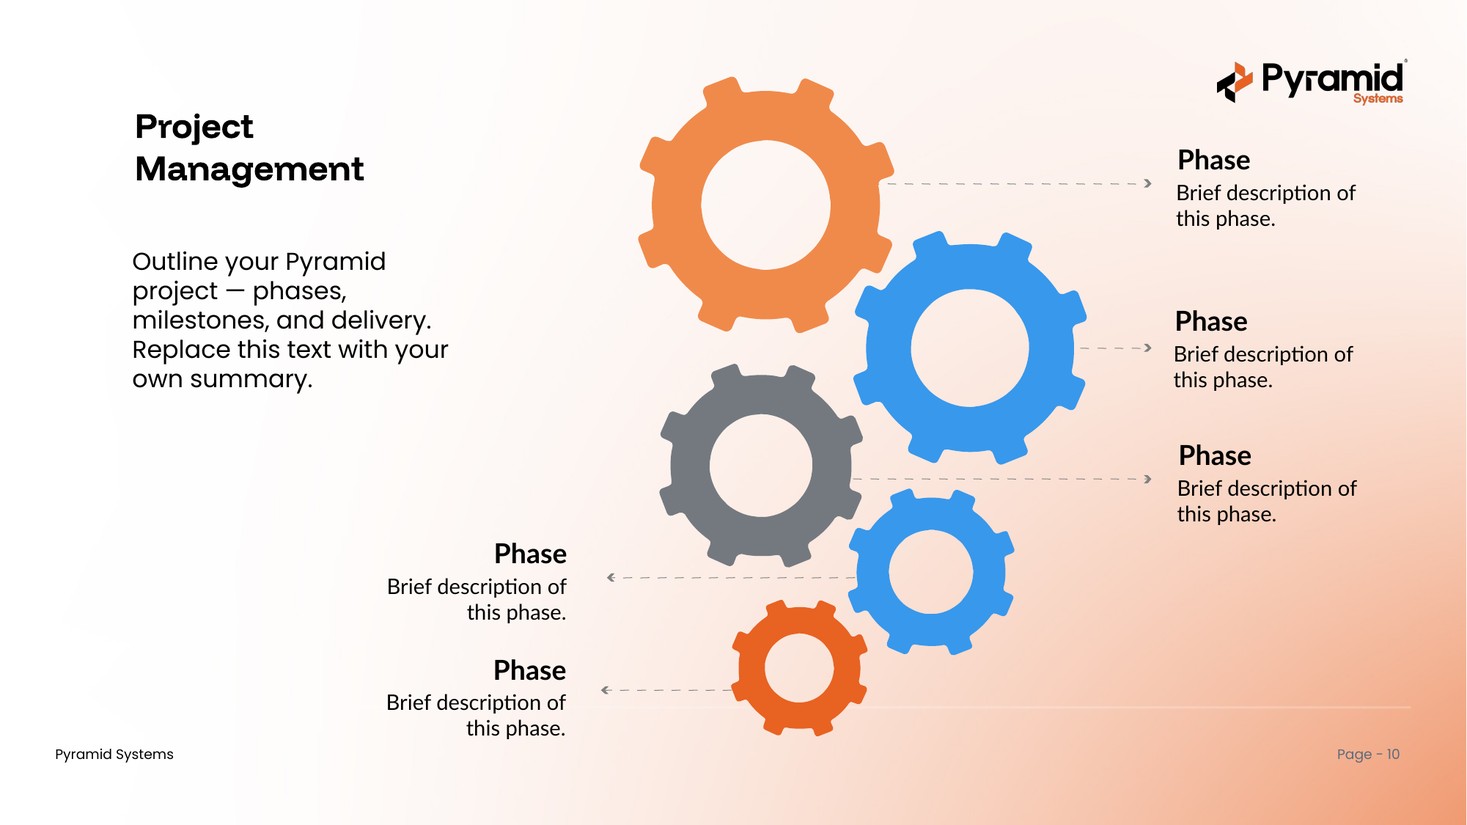
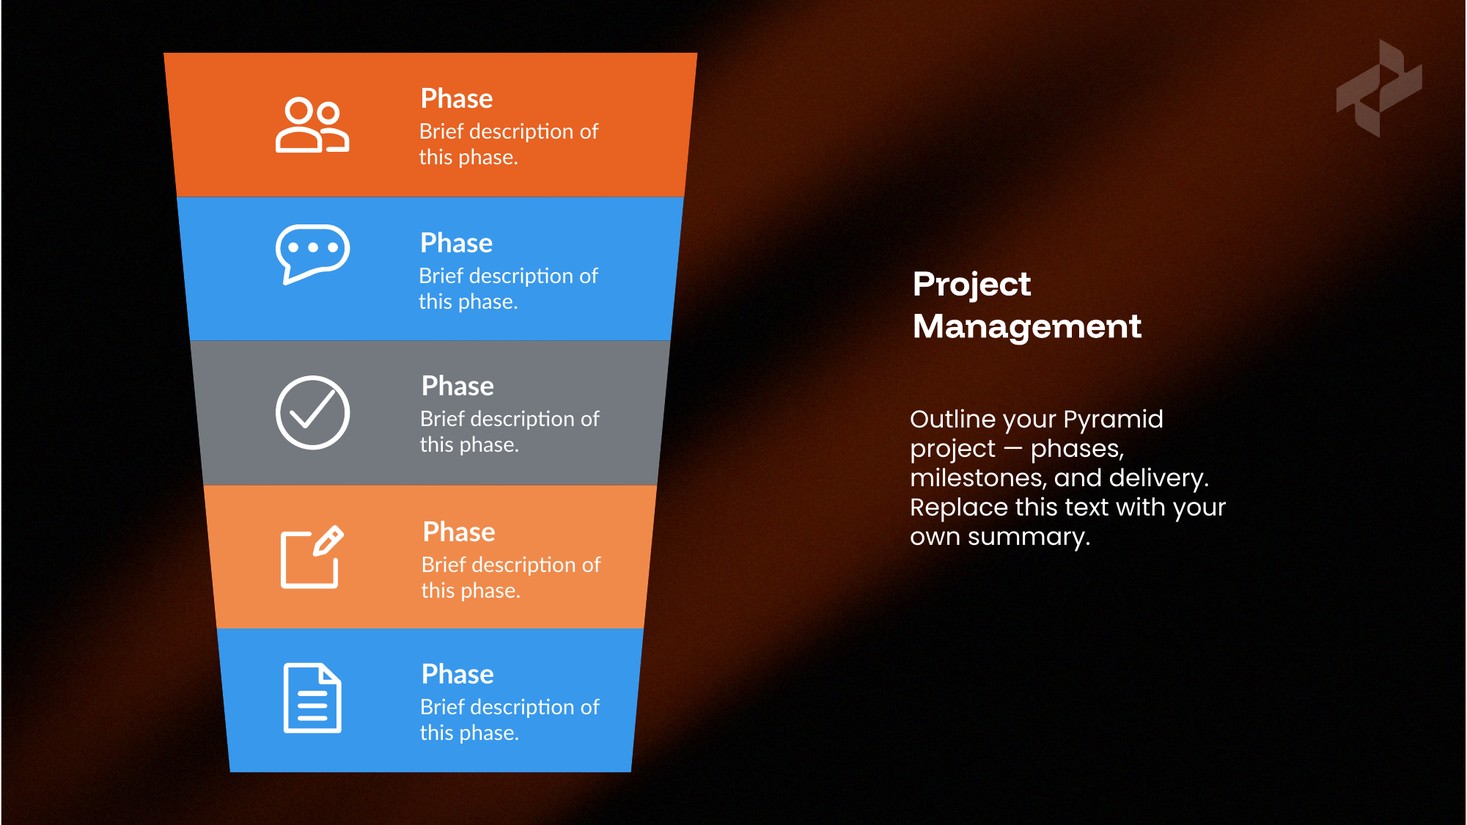
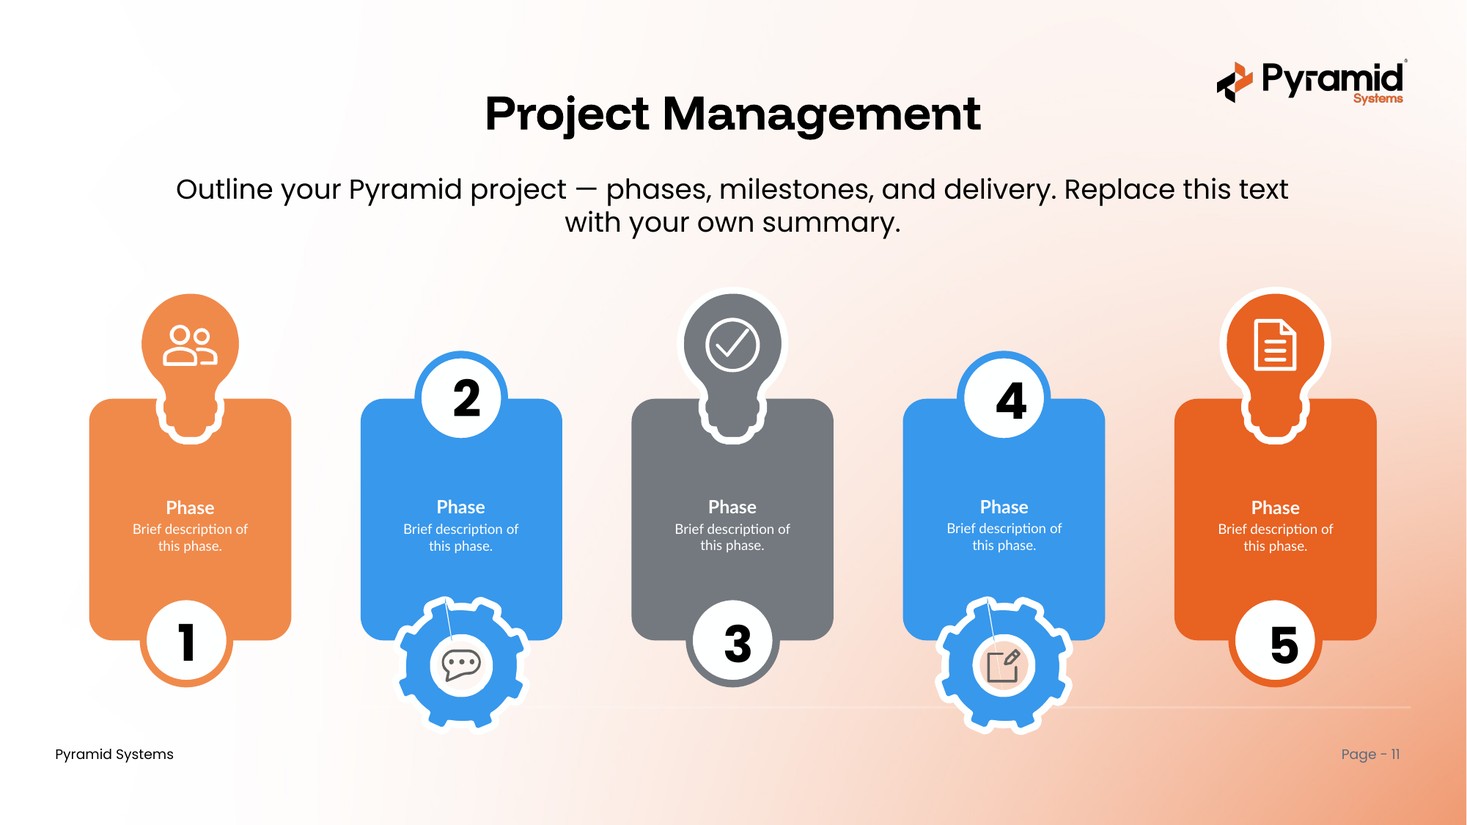
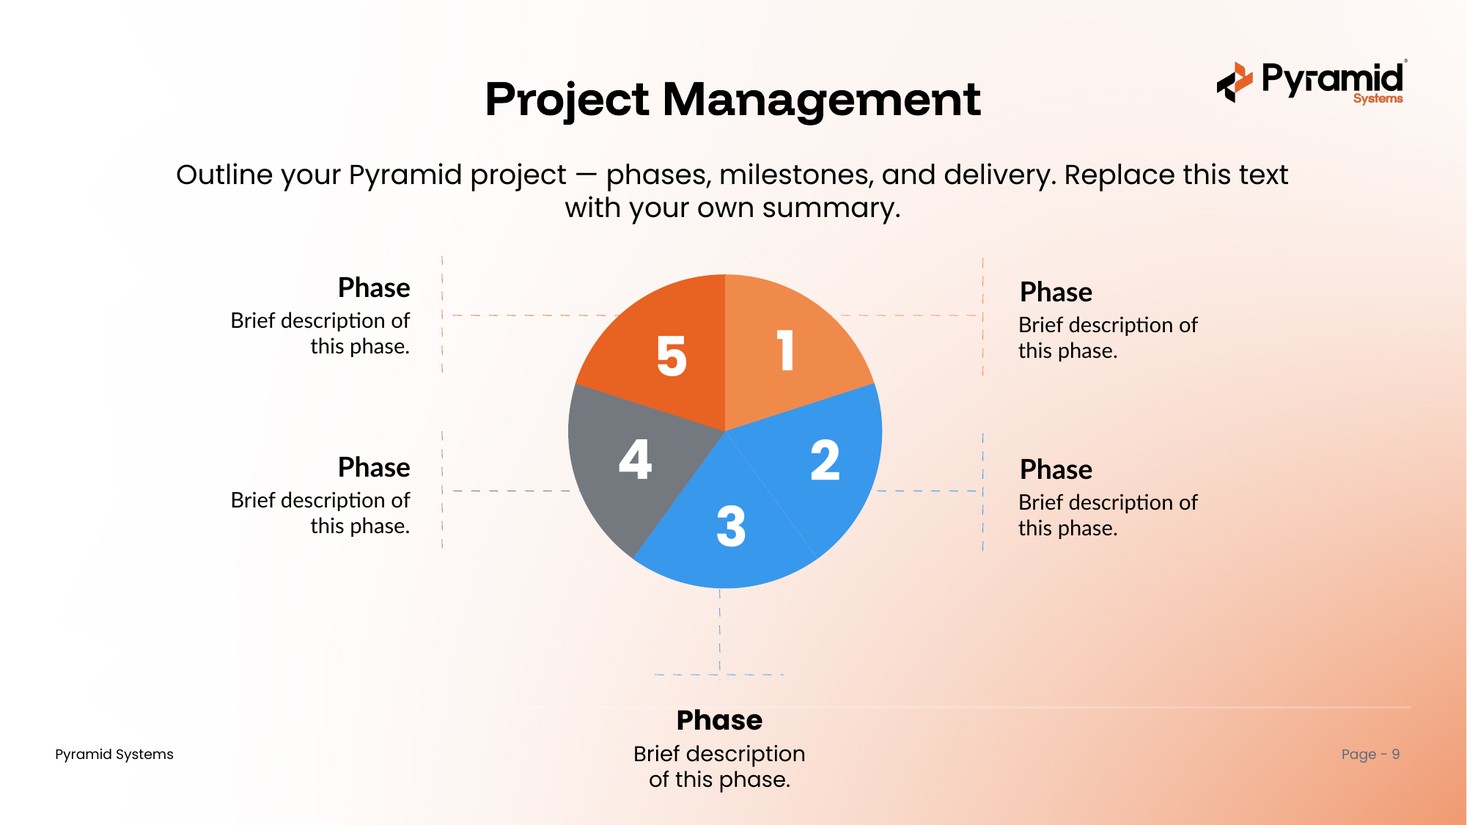
Project Management
16 branded, editable project-management infographics in light and dark themes — cards, process flows, cycles, gears, and step lists.
View template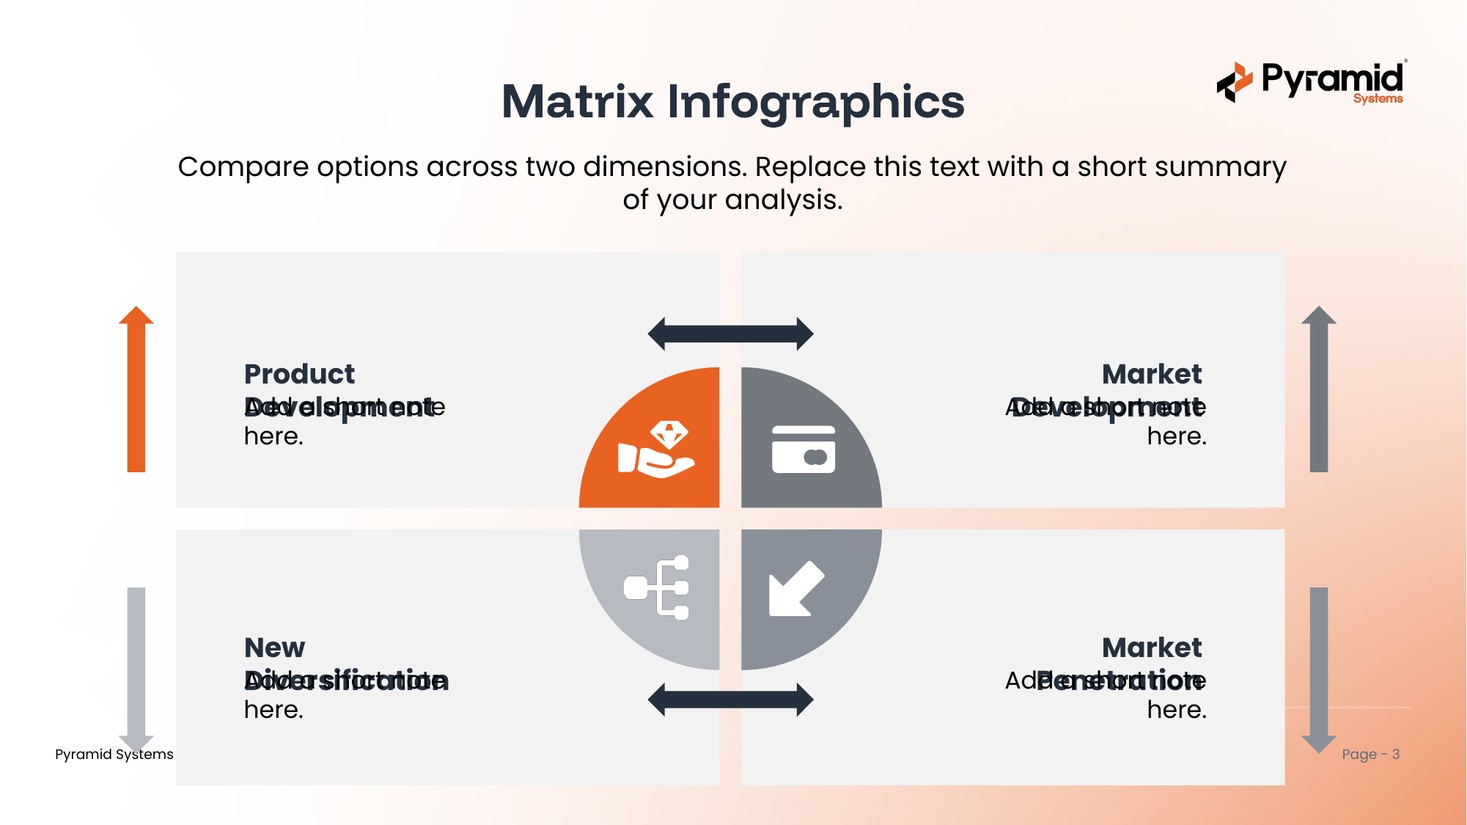
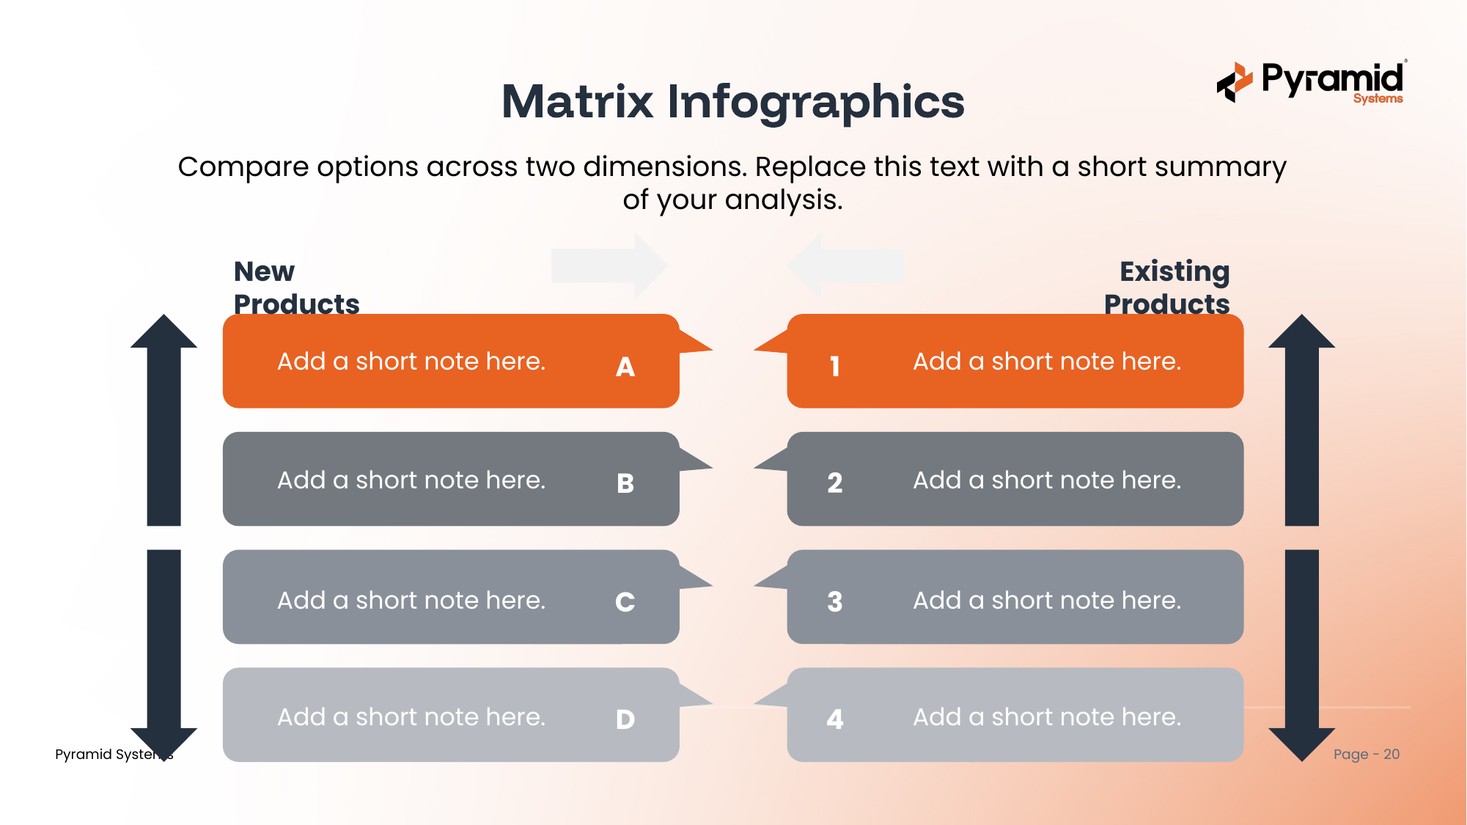
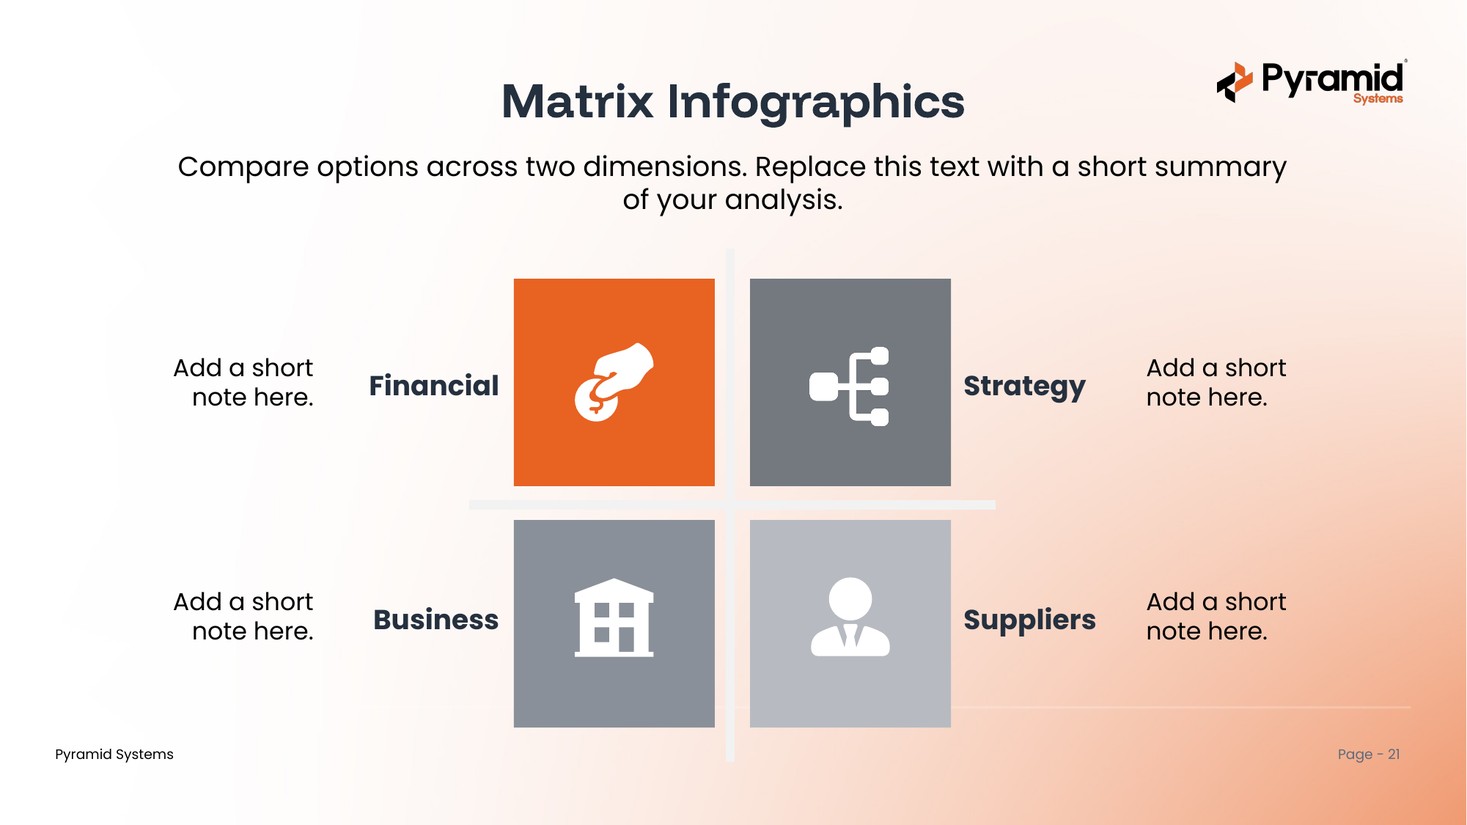
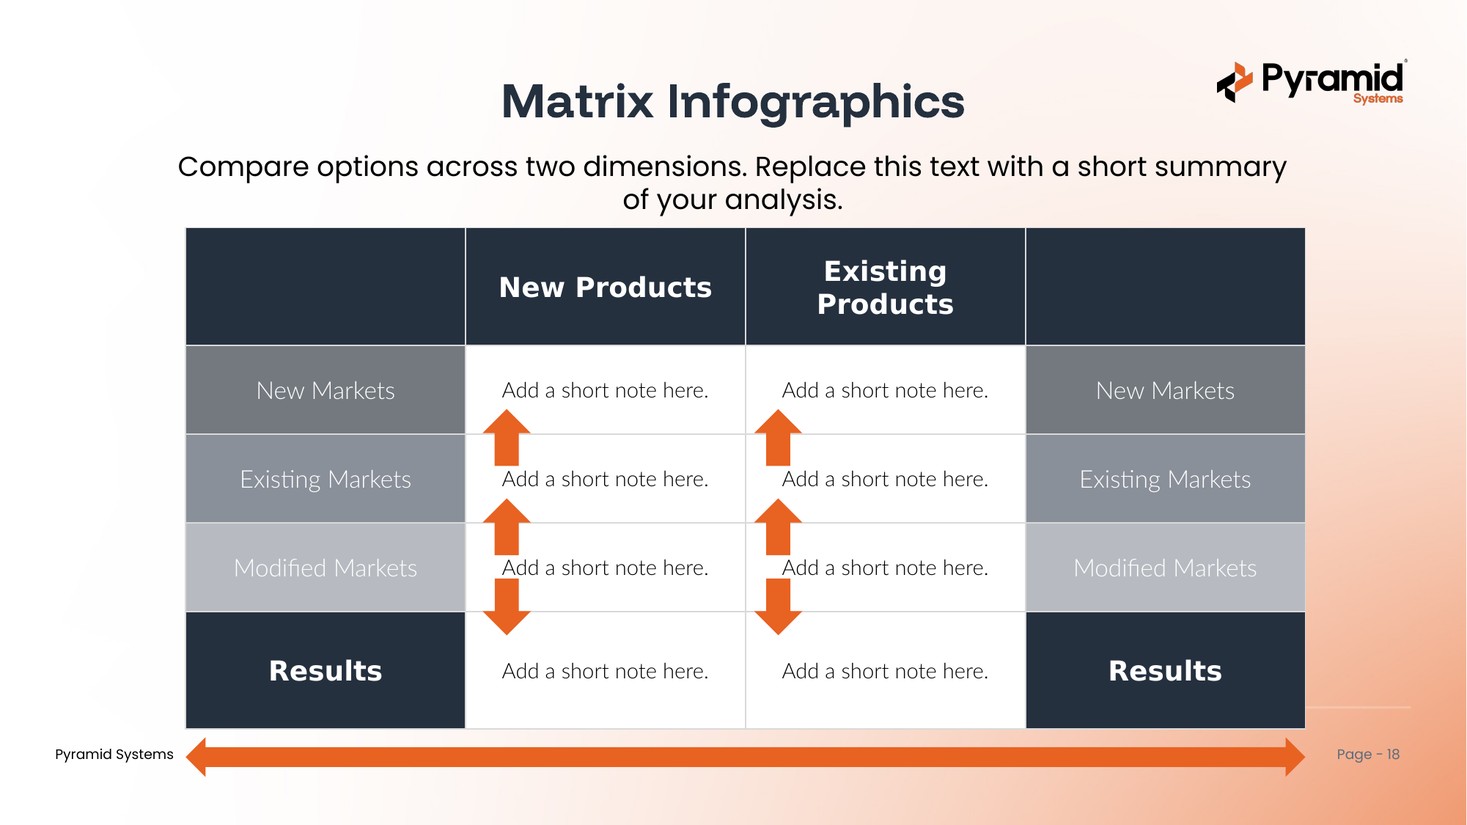
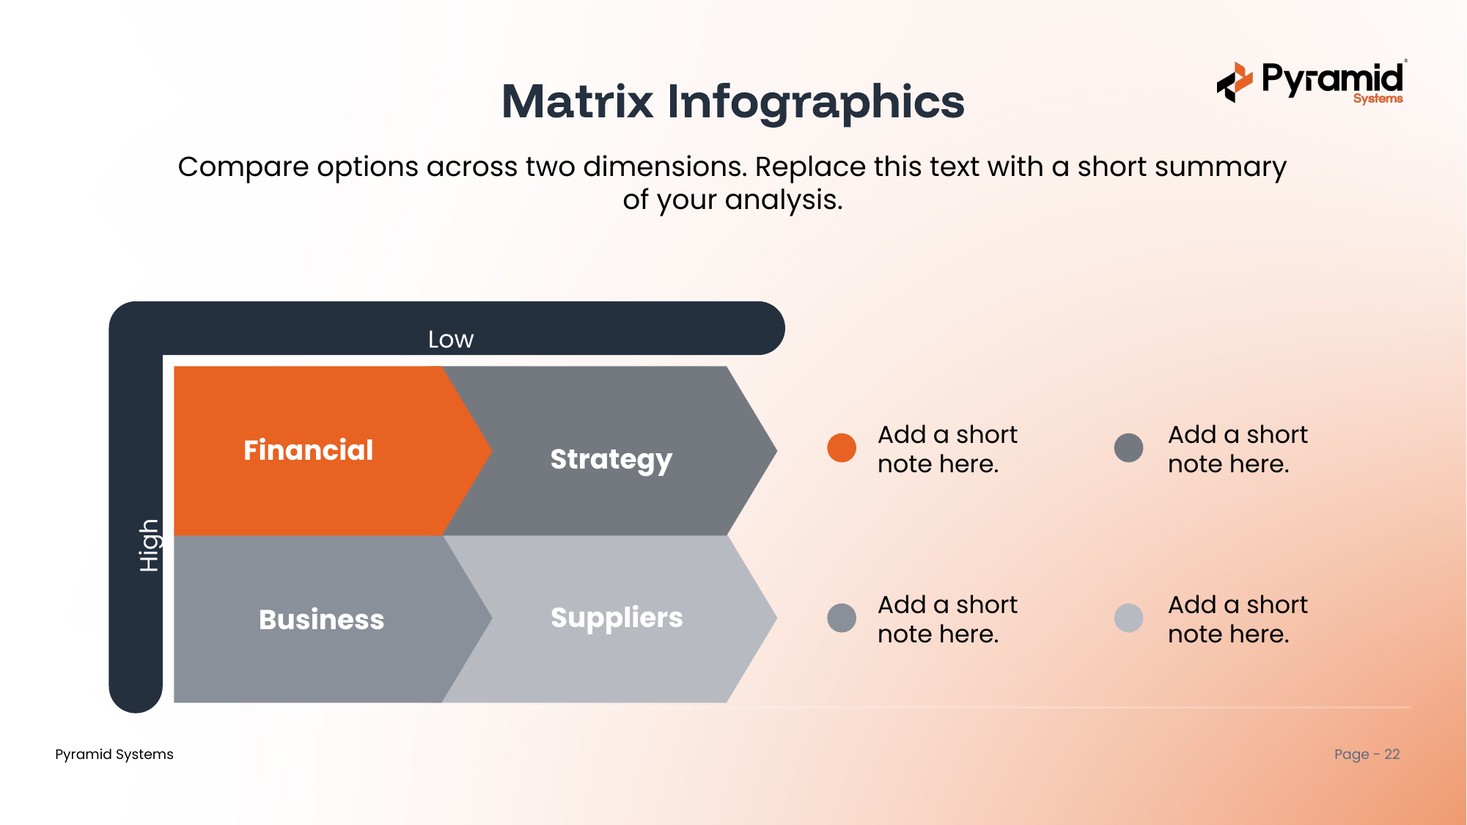
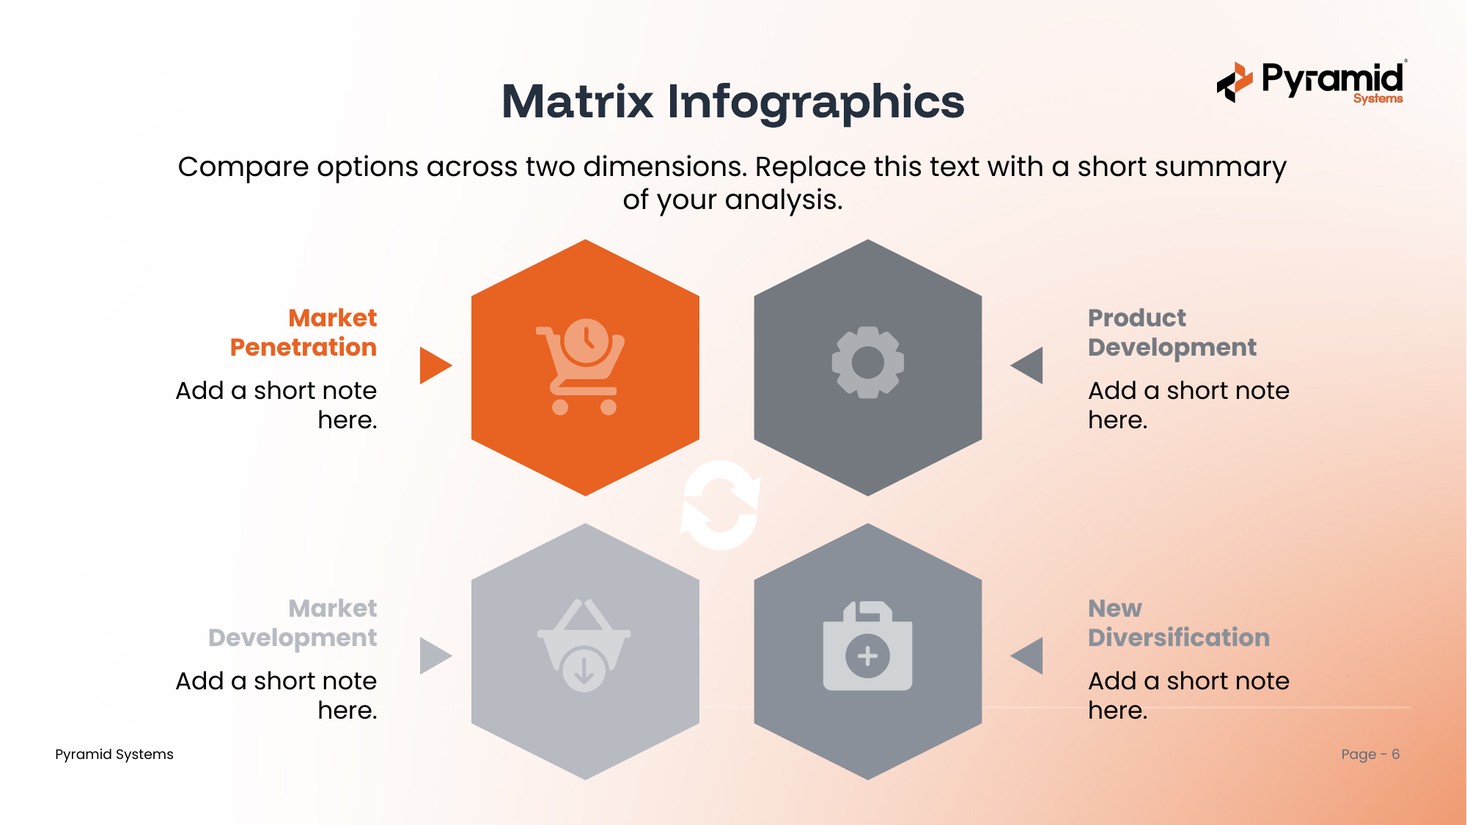
Matrix Infographics
20 branded, editable matrix layouts — 2×2 quadrants, comparison matrices, priority grids, and scorecard tables. Copy one in and edit the labels.
View templateNo infographics match that search. Try another term, clear the filters, or ask Yahia.
Coming soon
In the worksMarketing Flywheel
Flywheel and loop diagrams to show momentum, growth, and how the pieces of a program reinforce each other.
Risk Management Infographics
Risk matrices, heat maps, and mitigation visuals for program reviews and capture decisions.
Process & Workflow Diagrams
Step flows, swimlanes, and architecture canvases for explaining how things work, end to end.
Need a presentation template that isn't here?
Tell us what would help, and we'll add it to the library. New templates are announced to the whole team — no sign-up needed.
Request a template