

Presentation Template · PPTX
Powerful Charts
A library of branded, fully editable charts — bar, pie, line, area, radar, and bubble. Copy a chart into your deck, then right-click and edit the data with your own numbers. Colors, fonts, and layout are already on-brand.
Download .pptx
PowerPoint · works in the desktop & web apps
Chart types included
Every chart is a real, editable PowerPoint chart — swap in your data. A few examples:
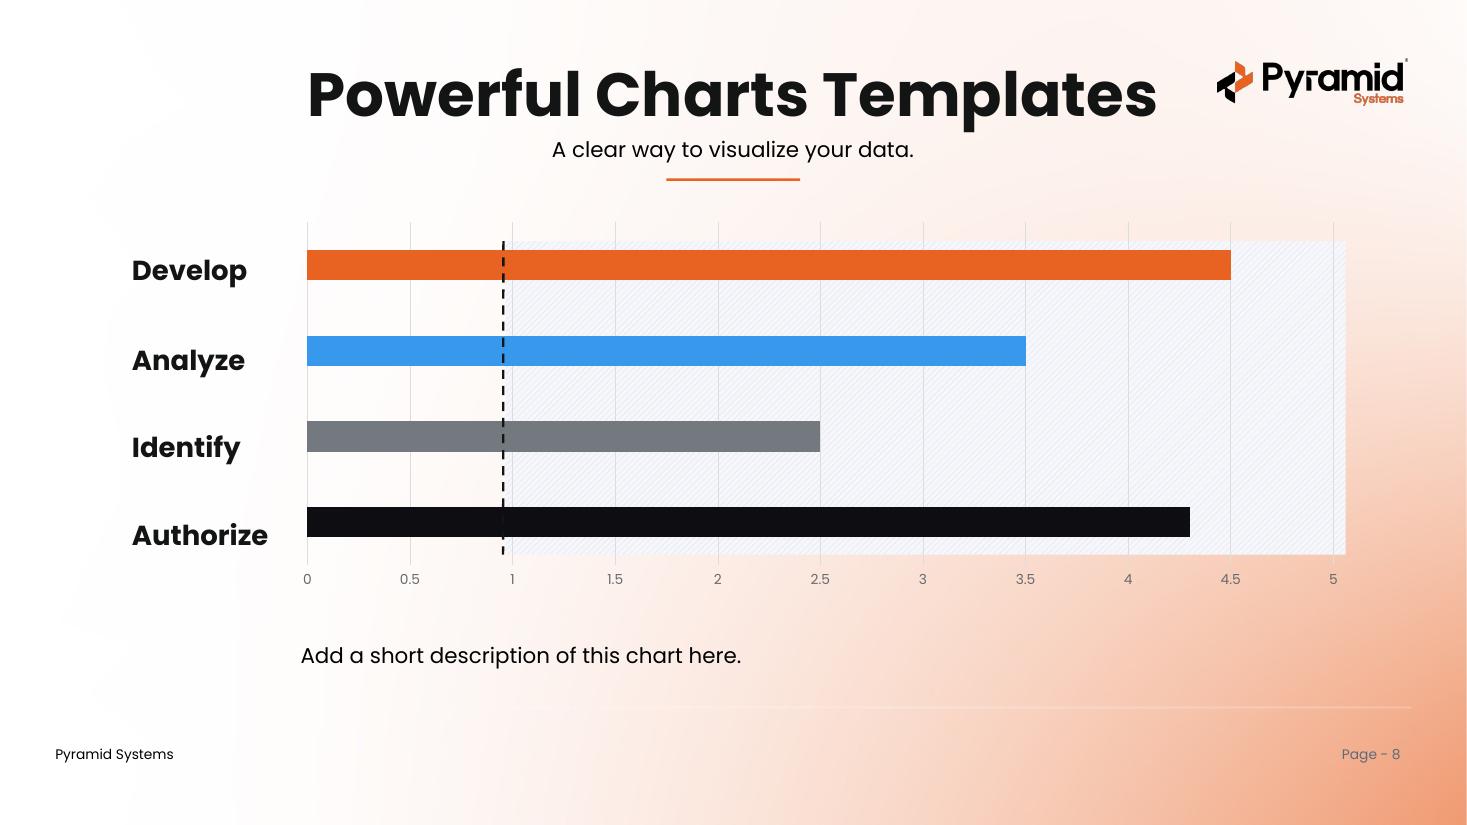
Bareditable
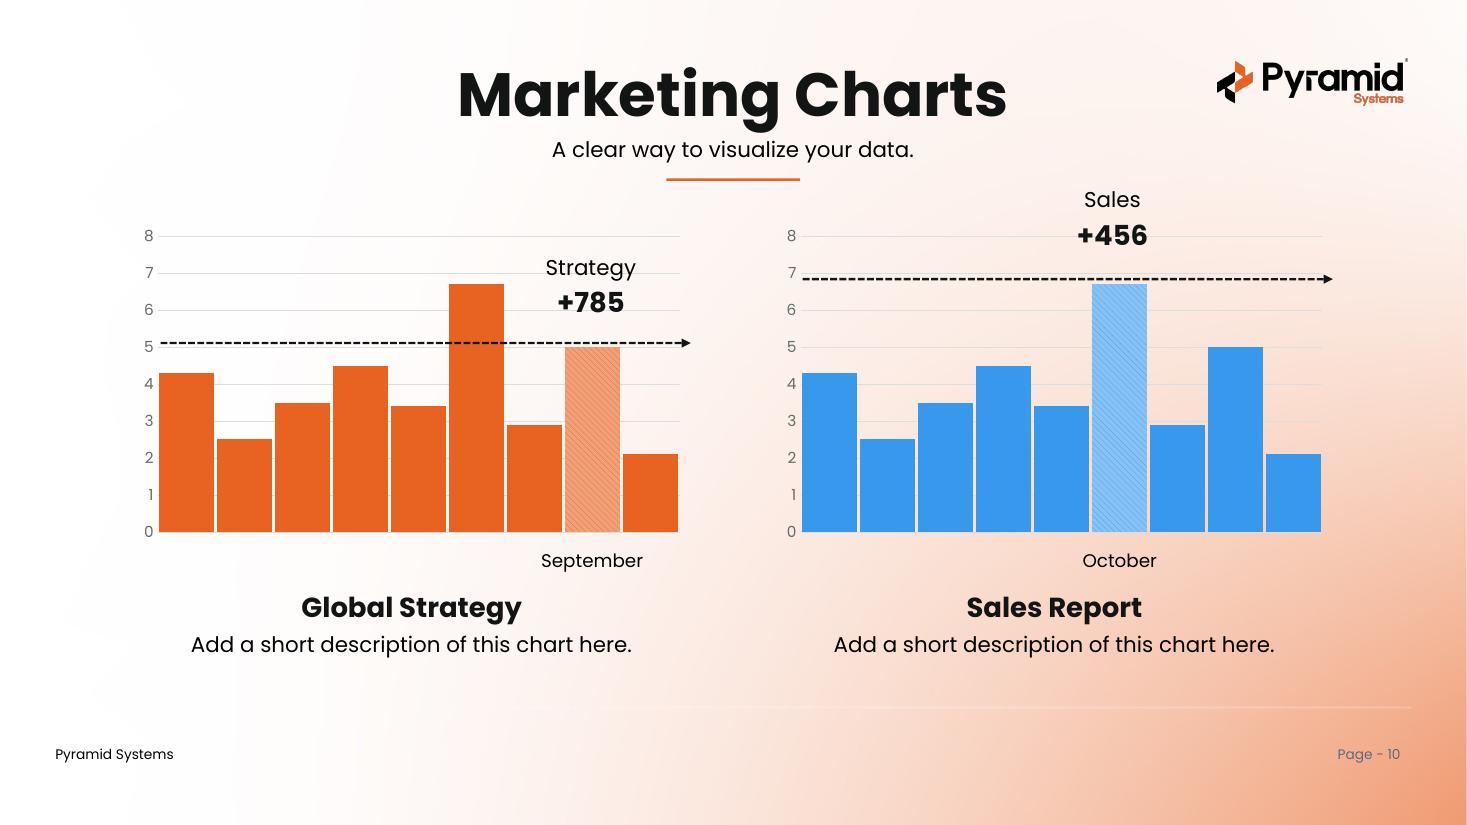
Columneditable
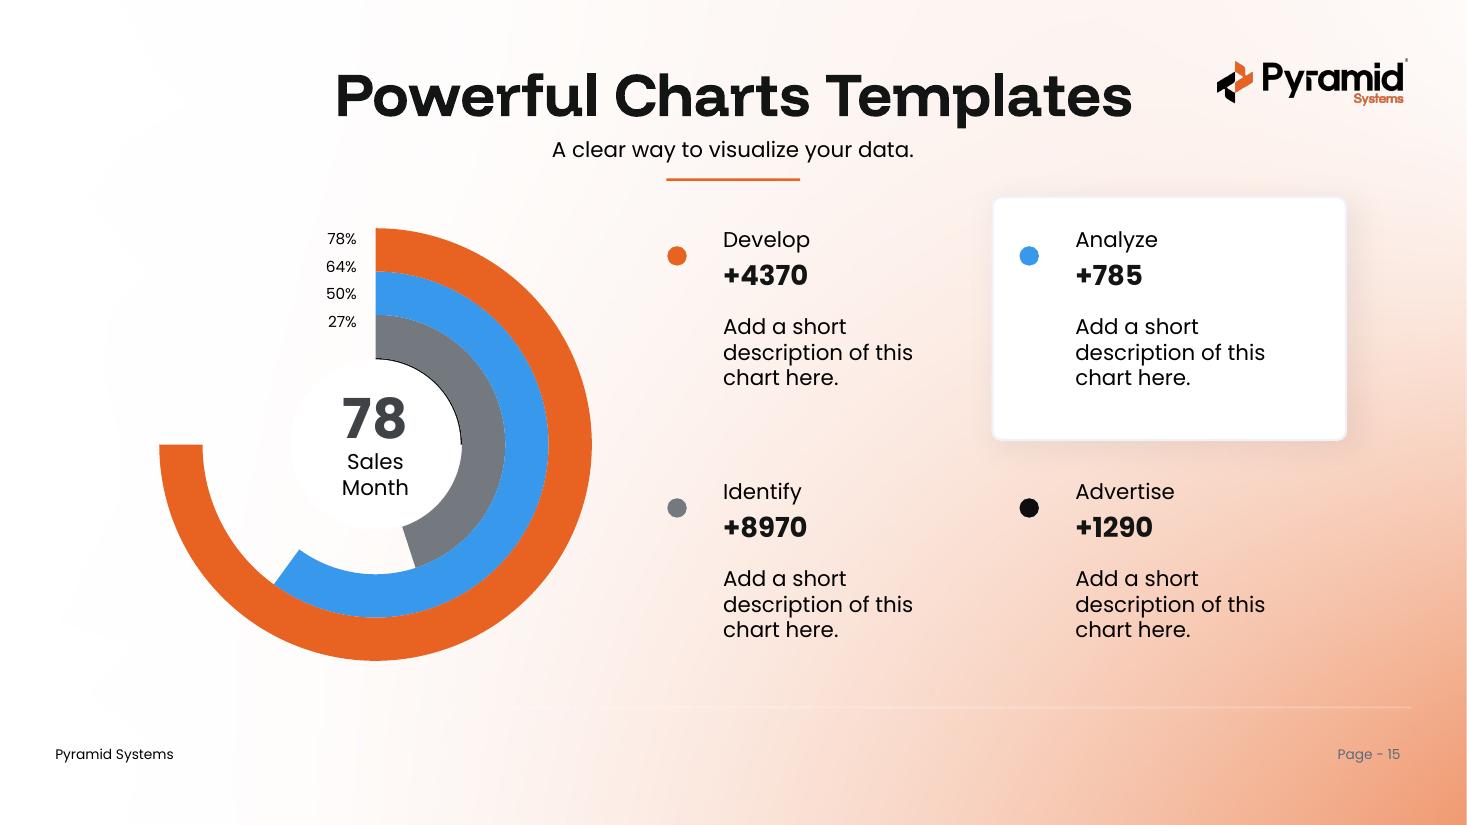
Radialeditable
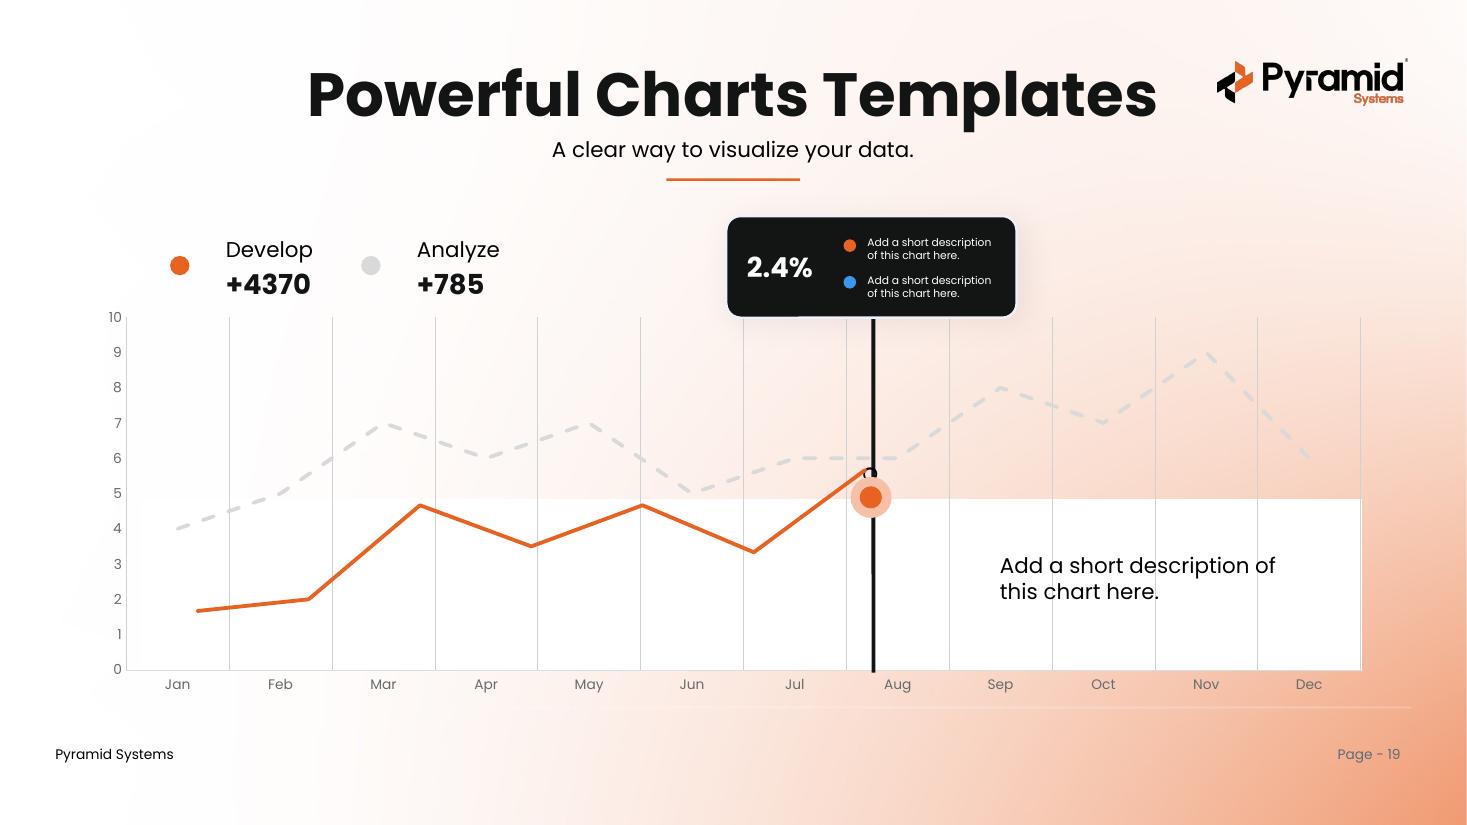
Lineeditable
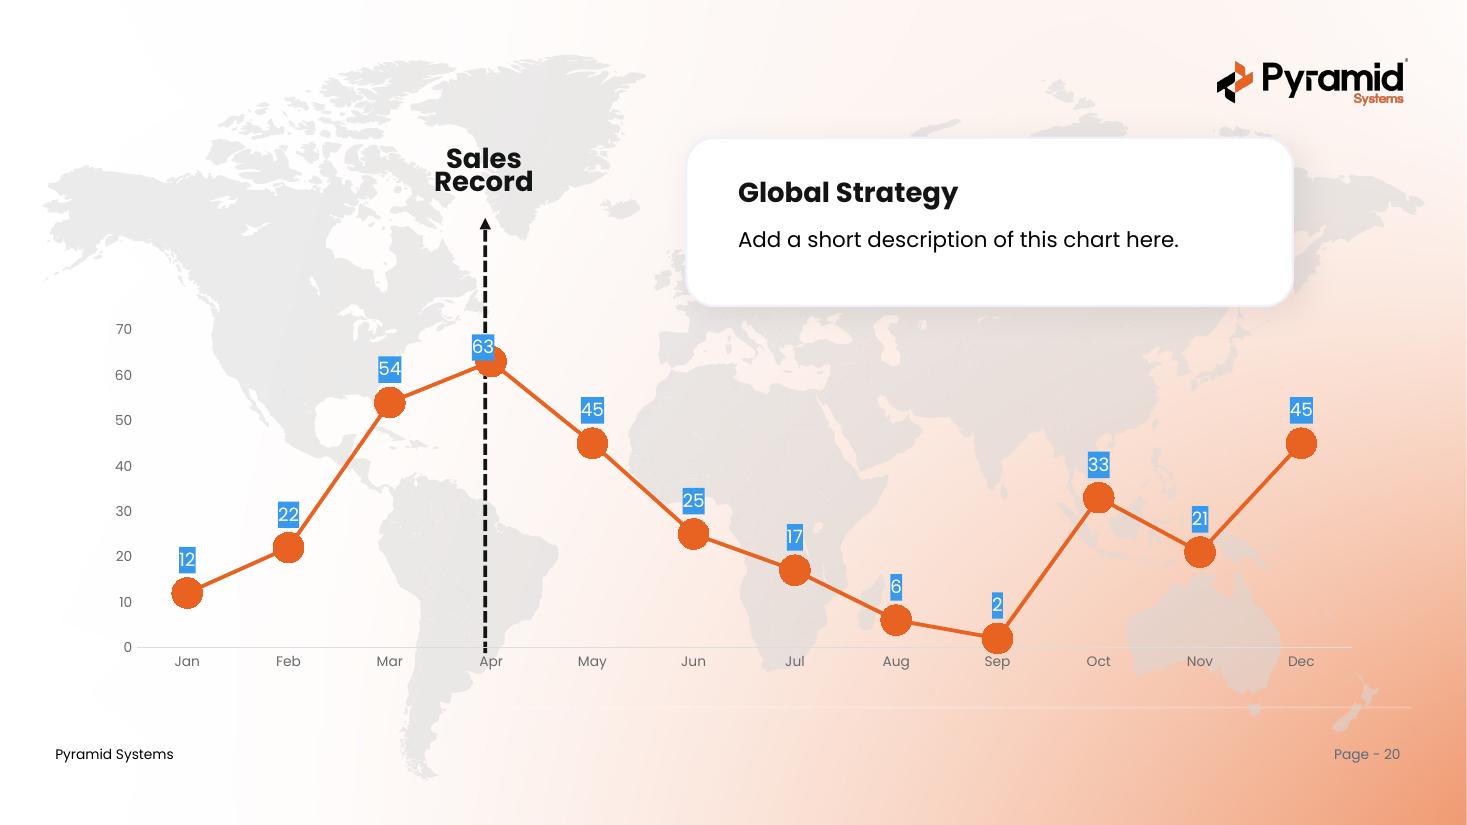
Trend Mapeditable
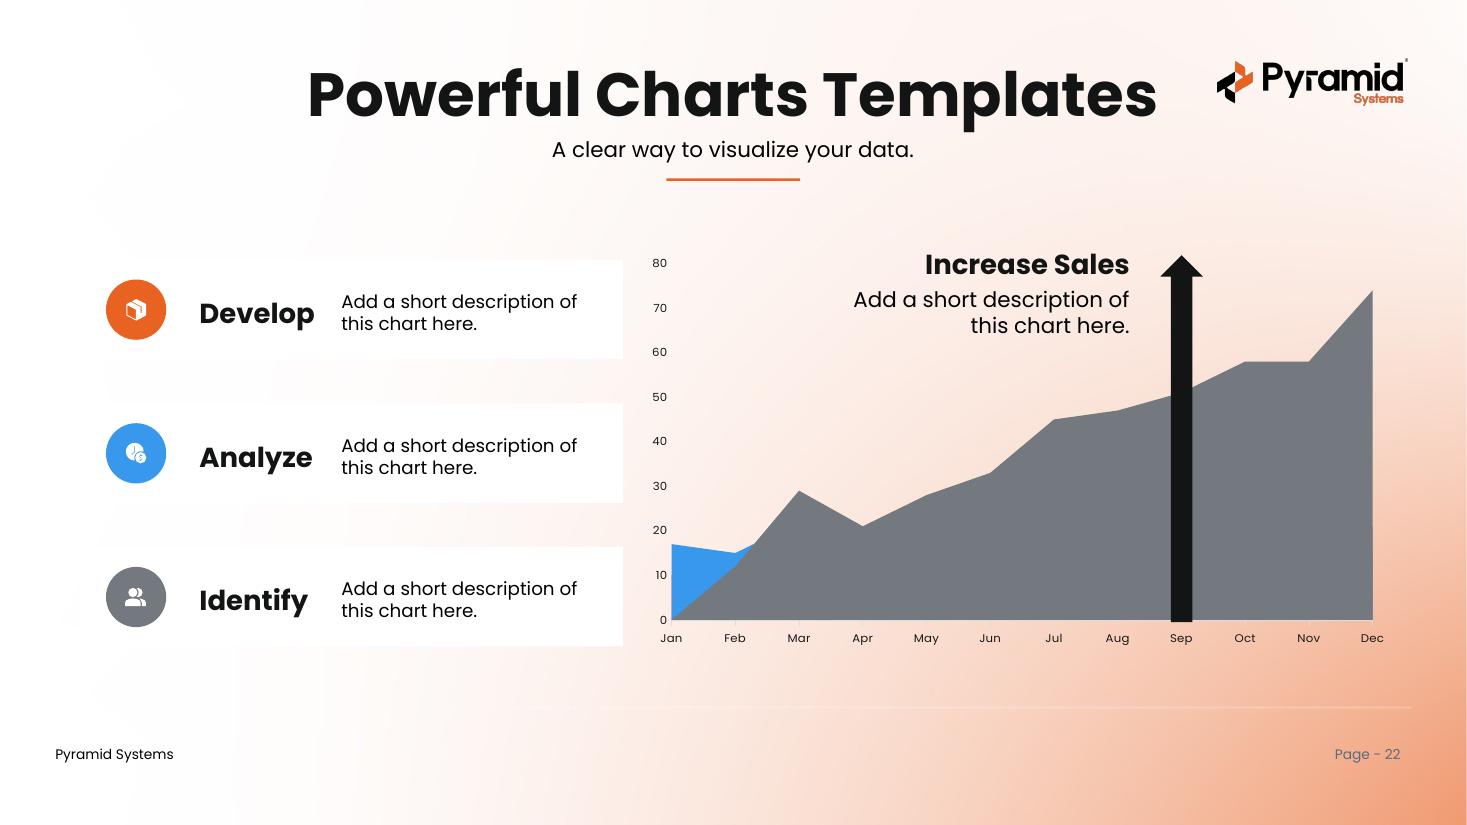
Areaeditable
What's inside & how to use it
One deck, built on the Pyramid master template.
What's inside
- A cover, a contents page, and a section divider for each chart family
- 30+ real, editable charts — bar, pie, line, area, radar, and bubble
- All eight master-deck layouts, selectable under New Slide
- Pyramid brand colors and fonts throughout (Funnel Display + Poppins)
- A cover and a Questions & Discussion closing slide
How to use it
- Open the deck and scroll to the chart you like.
- Copy that slide (or just the chart) into your own presentation.
- Right-click the chart and choose Edit Data to drop in your numbers.
- Prefer to start here? Build with the eight brand layouts under New Slide.
Get the charts deck
One PowerPoint file with 30+ branded, editable charts. Ready to use across the Pyramid team.
Download .pptx