

Presentation Template · PPTX
Business Charts
A library of branded, editable business charts — bar, column, line, area, donut, and KPI visuals. Copy a chart into your deck, then right-click and edit the data with your own numbers. Colors, fonts, and layout are already on-brand.
Download .pptx
PowerPoint · works in the desktop & web apps
Chart types included
Every chart is a real, editable PowerPoint chart — swap in your data. A few examples:
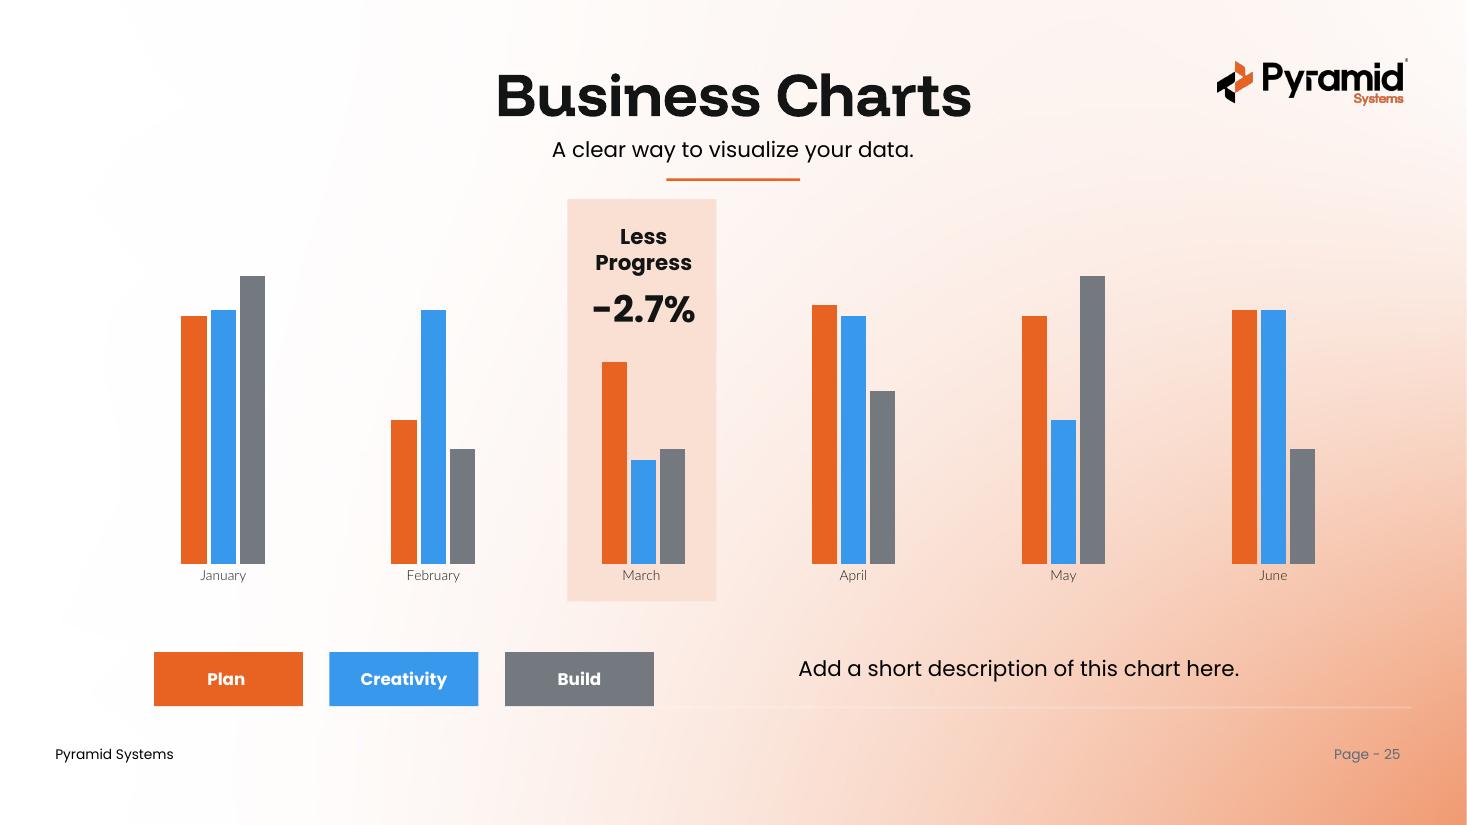
Columneditable
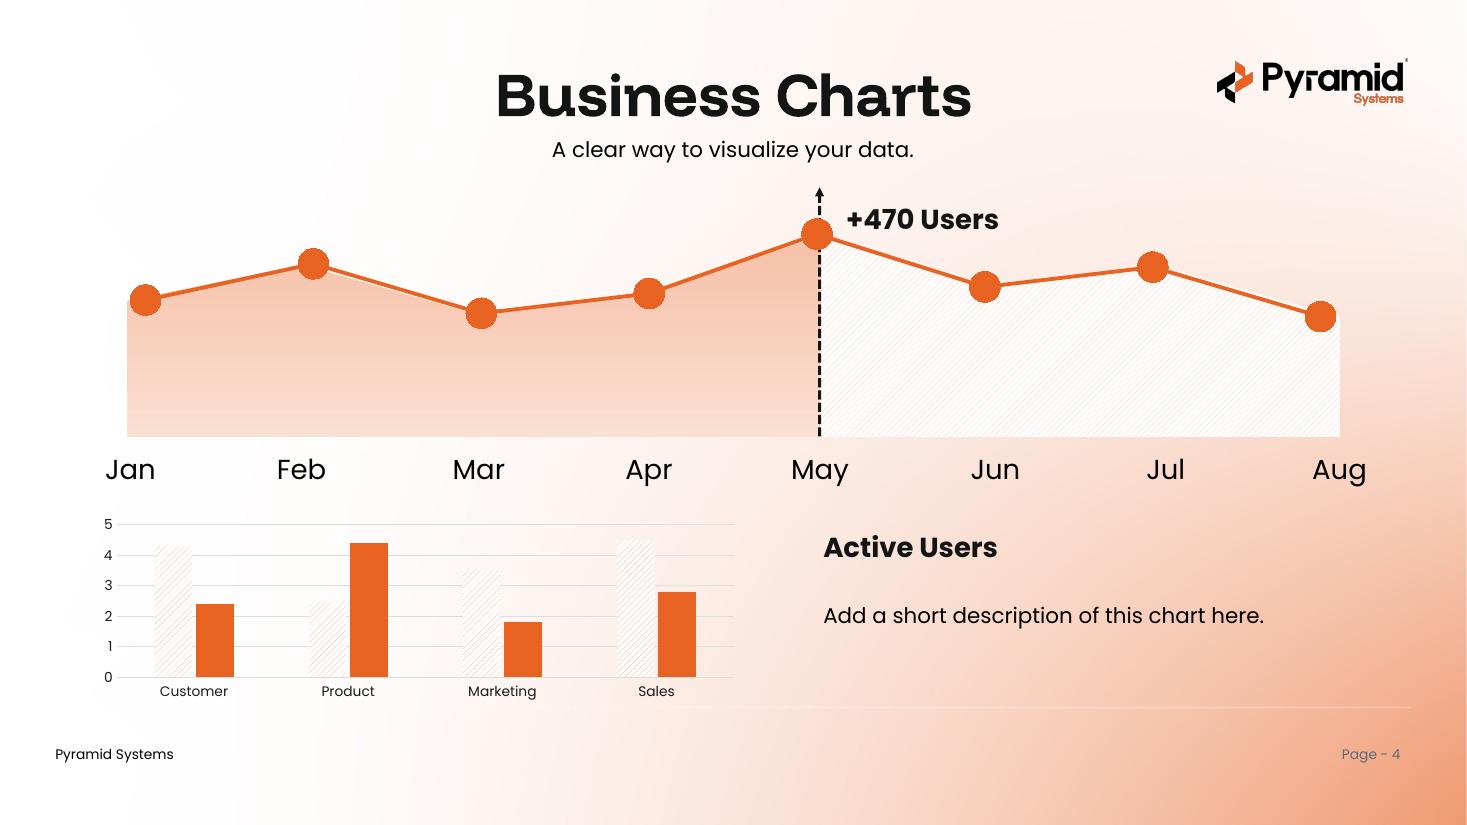
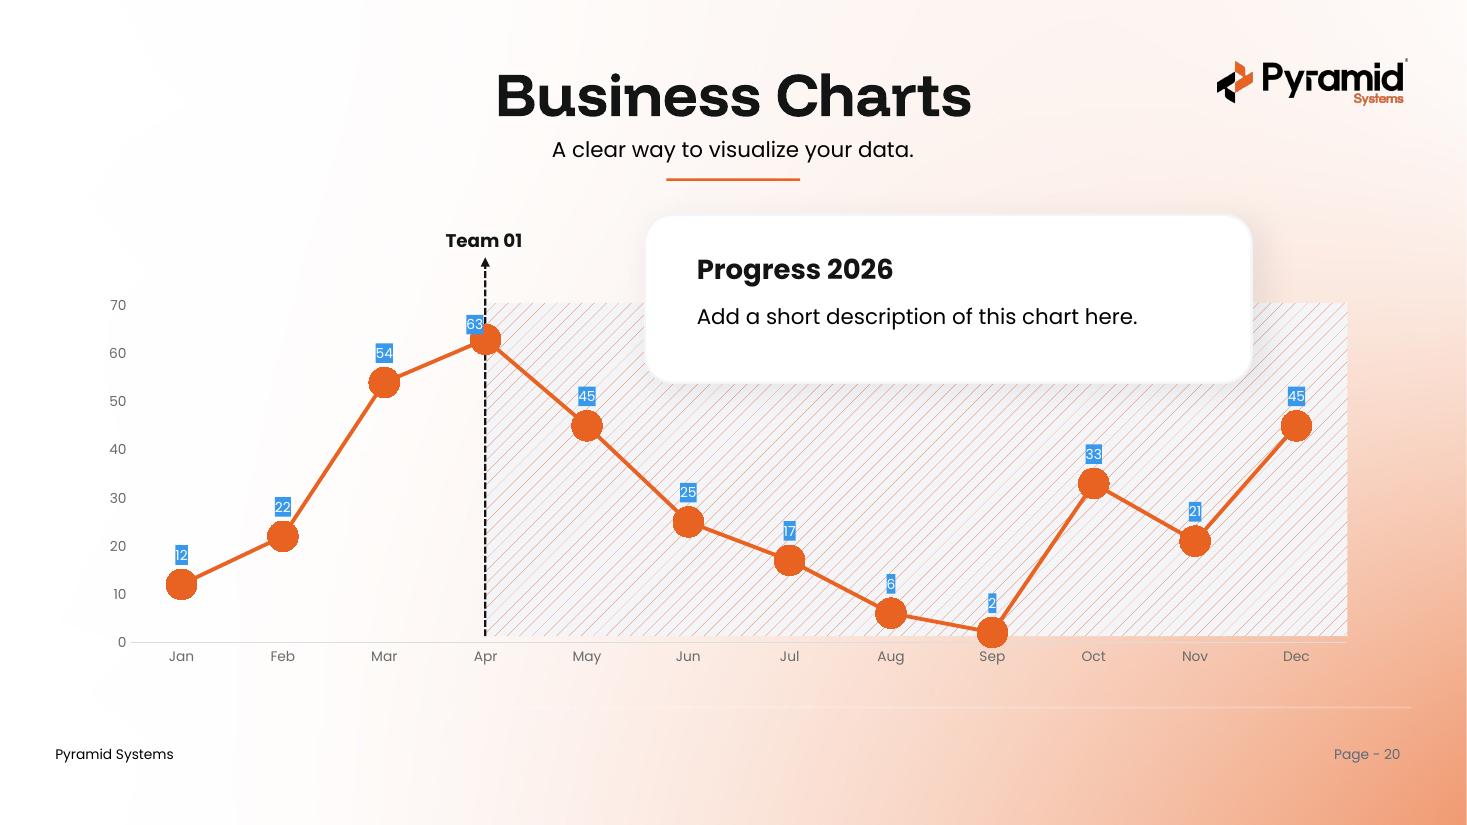
Line + Bareditable
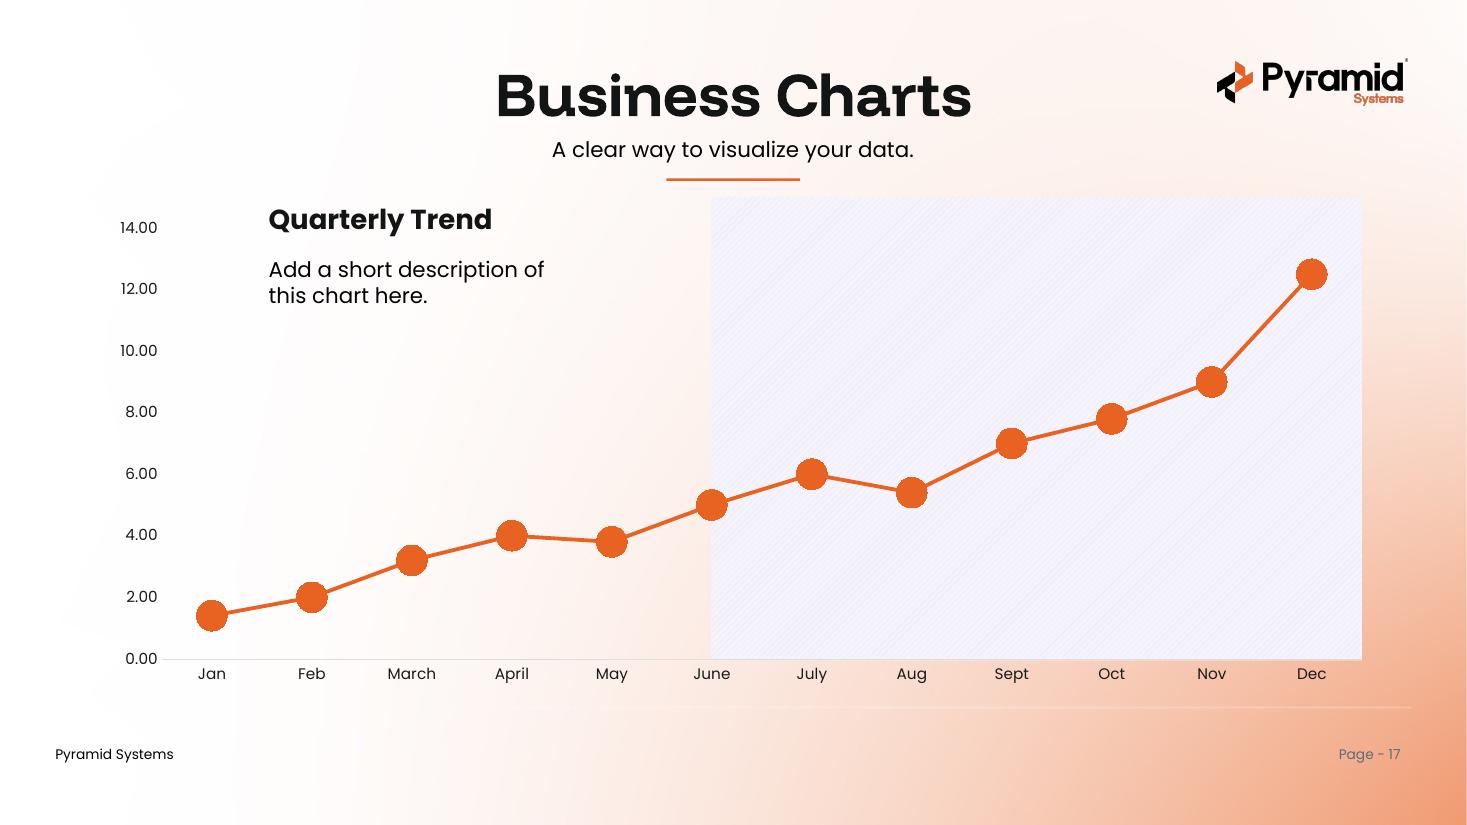
Lineeditable
Markerseditable
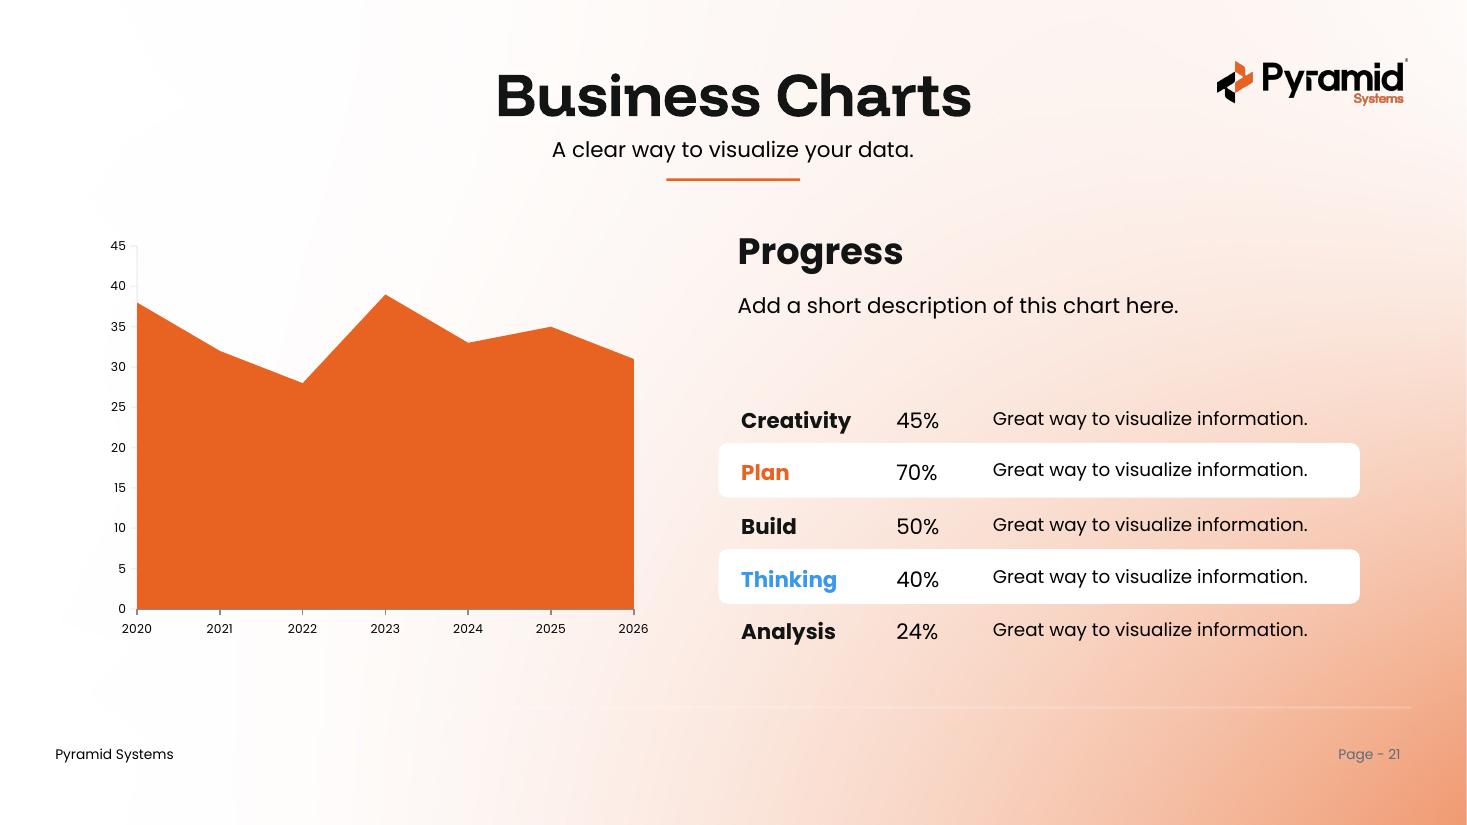
Areaeditable
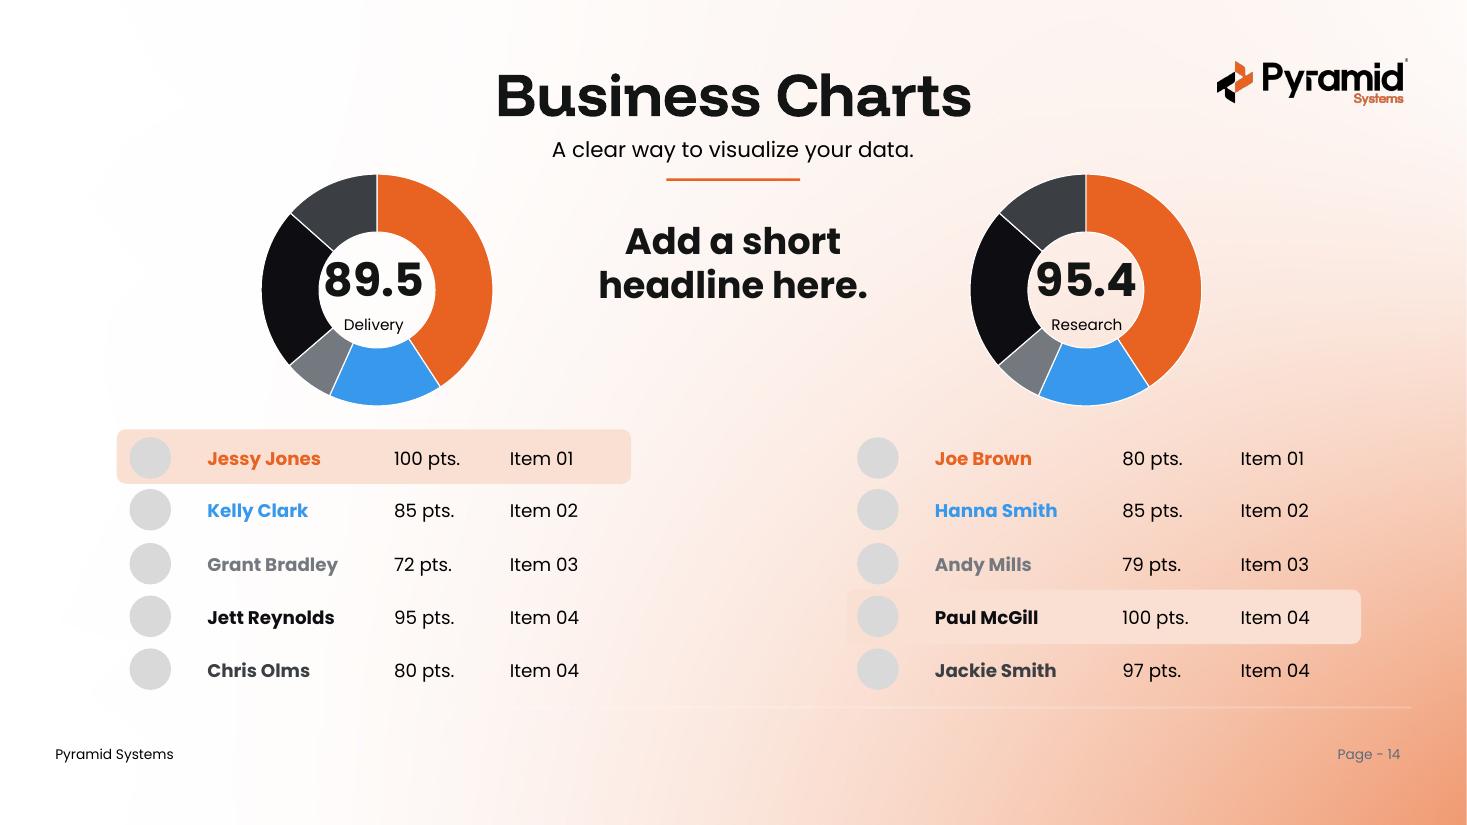
Donut & KPIeditable
What's inside & how to use it
One deck, built on the Pyramid master template.
What's inside
- A cover, a contents page, and a section divider for each chart family
- 20 chart designs — bar, column, line, area, donut, and KPI visuals
- All eight master-deck layouts, selectable under New Slide
- Pyramid brand colors and fonts throughout (Funnel Display + Poppins)
- A cover and a Questions & Discussion closing slide
How to use it
- Open the deck and scroll to the chart you like.
- Copy that slide (or just the chart) into your own presentation.
- Right-click the chart and choose Edit Data to drop in your numbers.
- Prefer to start here? Build with the eight brand layouts under New Slide.
Get the business charts deck
One PowerPoint file with 20 branded, editable charts. Ready to use across the Pyramid team.
Download .pptx